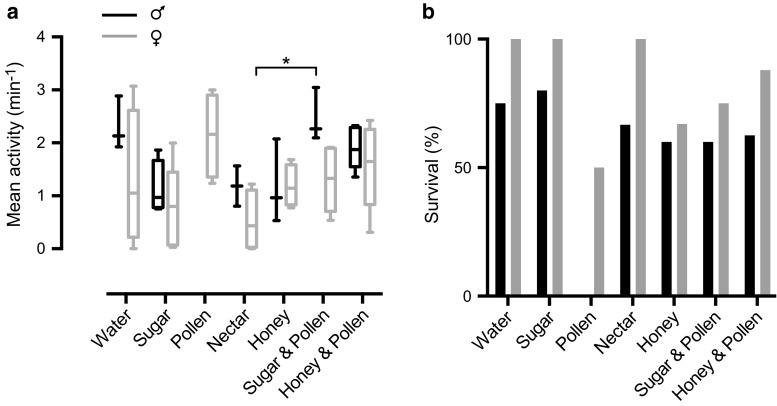
Fig. 4.
Sexually dimorphic dependence on diet. a The data show the activity as a function of diet for 2.5–3.5 months old hoverflies. We only show the activity for the hoverflies that survived the whole experiment. Starting from the box plot on the left, n = 3, 4, 4, 5, 4, 2, 4, 3, 4, 3, 6, 5 and 7, N = 6. Female activity is shown in gray and male activity in black. The star shows a significant difference (P < 0.05, two-way ANOVA with Tukey’s post hoc test). b The data show the percentage of hoverflies that survived until the end of the 2nd day, with female survival in gray and male survival in black. The data include the hoverflies in panel (a), but also those that died during the experiment, thus n = 4, 4, 5, 5, 6, 8, 3, 4, 5, 6, 5, 8, 8 and 8, N = 6

