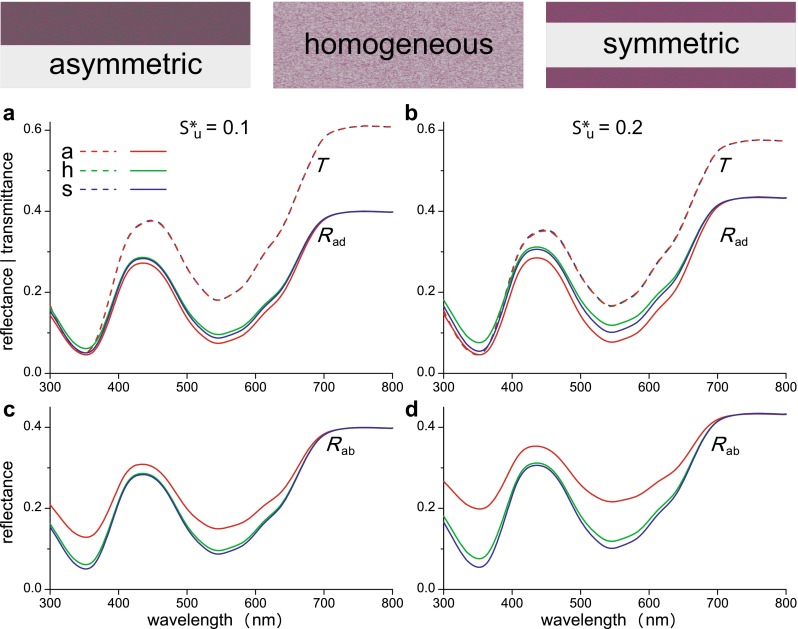
Fig. 5.

Transmittance and reflectance spectra of a few differently organized model flower petals. a, b Transmittance (T) and adaxial reflectance (R ad) spectra. c, d Abaxial reflectance (R ab) spectra. The spectra are calculated for two values of the scattering parameter of the unpigmented layer, : 0.1 (a, c) and 0.2 (b, d). The three model petals had the same amount of pigment and scattering distributed asymmetrically (a), homogenously (h), or symmetrically in the adaxial and abaxial layer (s)
