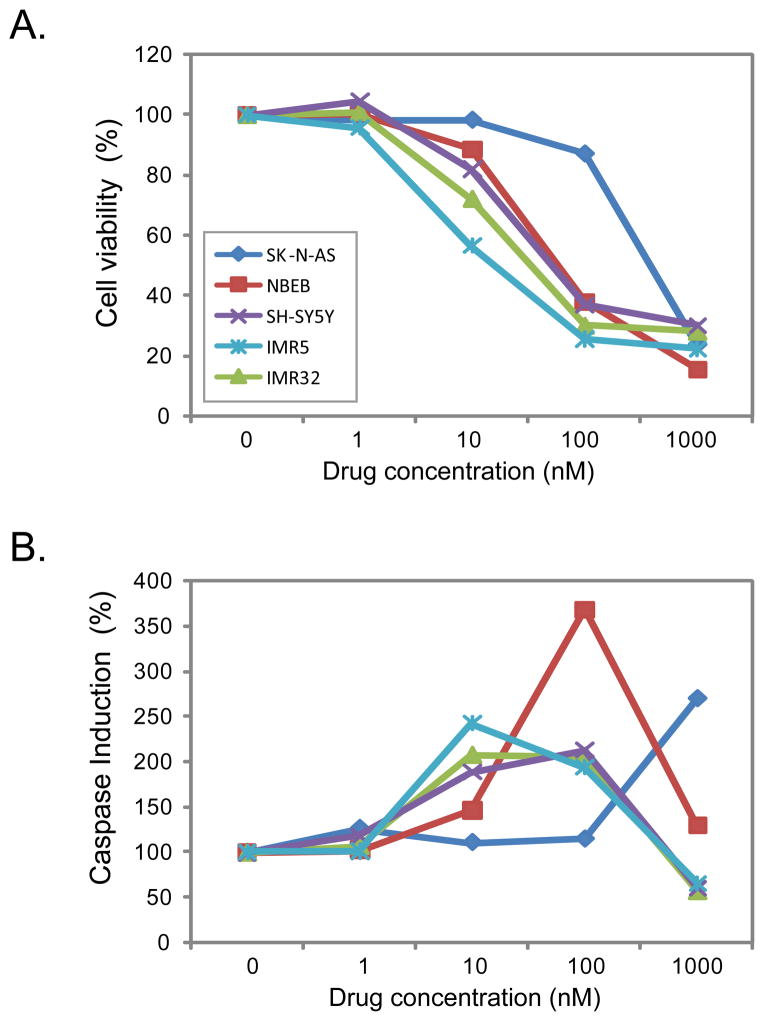
Figure 1. EAD inhibits cell growth and induces apoptosis in multiple neuroblastoma cell lines.
Five NB cell lines including three MYCN-not-amplified (SK-N-AS, NBEB, and SH-SY5Y) and two MYCN-amplified cell lines (IMR5 and IMR32) were used in this experiment; the cells were treated with EAD at 1, 10, 100 and 1000 nM. The cell viability (A) and caspase-Glo 3/7 activities (B) were measured at 24 hours after the drug treatment. The percentage of cell viability or caspase activity was calculated by normalizing the measurement of drug treatment to no treatment (dose of 0 nM). The data shown is a mean representative of the three independent measurements. SK-N-AS,
 ; NBEB,
 ; SH-SY5Y,
 ; IMR5,
 ; IMR32,
 .
.

