Fig. 4.
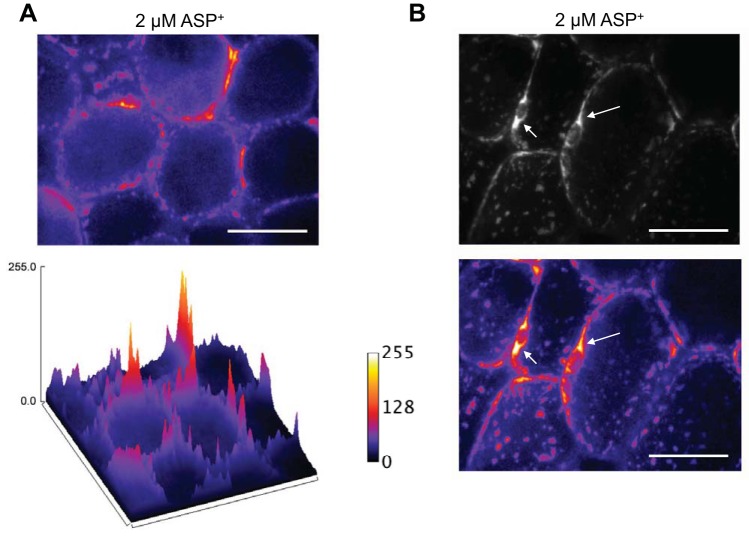
ASP+ is transported into mesenteric PVAT adipocytes. ASP+ (2 μM) was added to mesenteric PVAT for 10 min in PSS and imaged by confocal microscopy. A: pseudocolored representation of the fluorescence intensity of ASP+ (2 μM) binding revealing that ASP+ binds along on the periphery of the adipocyte in a punctate pattern (top). The surface plot of the same image shows this more clearly (bottom). Refer to the RFU scale to the right. Lighter (white-yellow) colors indicate higher fluorescence intensities as measured by RFU, and darker (violet-black) colors indicate lower fluorescence intensities. B, top: image of a PVAT adipocyte imaged at the level of the nucleus. Arrows point to areas of perinuclear staining. Pseudocolorization of the images (bottom) shows that intense staining was present in the perinuclear region. Images are representative of six animals. Scale bars = 50 μm. Samples were imaged with a ×40 objective.

