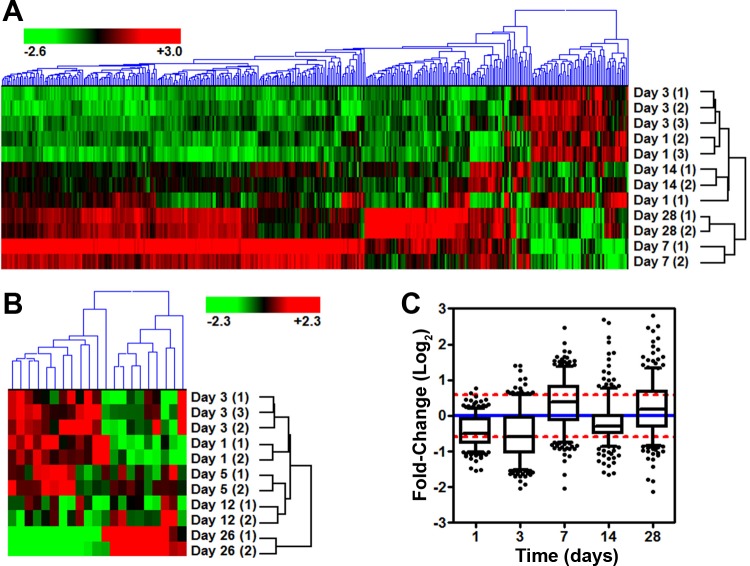
Fig. 1.
Gene microarray results for proton and iron irradiations (IRs). Hierarchical clustering using an Euclidean algorithm for gene lists with a fold-change greater than ±1.5 from iron-IR samples with a false discovery rate (FDR) < 0.1 (A), or proton samples with an FDR < 0.33 (B) are shown. Relative fold-change to the non-IR control is shown. C: plot of the average fold-change distribution by day with the 400-gene list from the iron-IR. Whiskers show the 5th to 95th percentile with outliers (solid circles). Red dashed lines show ±1.5 fold-change, and blue dash line shows no change compared with non-IR control samples.

