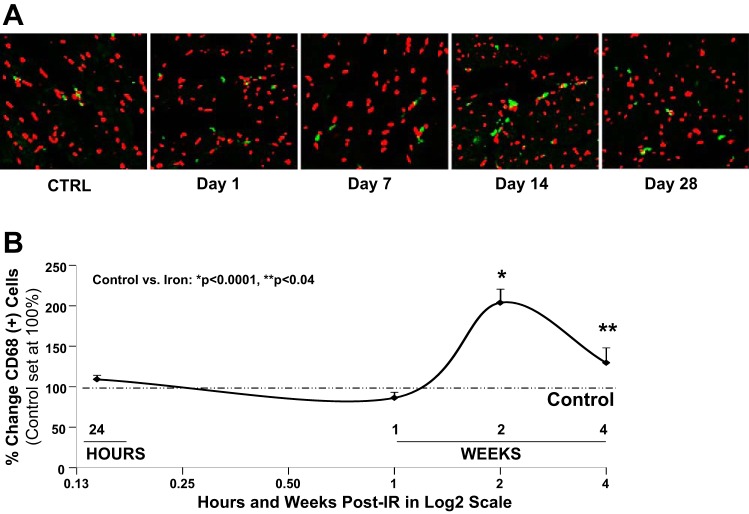
Fig. 2.
Inflammatory response in heart tissue after low-dose, full-body 56Fe-IR. A: representative ×400 confocal microscopy images for immunostaining with macrophage marker CD68 (green) and Topro-3 stained nuclei (red) in heart tissue after a single, low-dose, full-body 56Fe-IR in mice on days 1, 7, 14, and 28 post-IR, along with respective non-IR controls (CTRL). Note, when CD68-green cytoplasmic staining is overlaid with nuclei red staining, it appears as yellow/green staining. B: graphic representation of %change in CD68 positive (+) cells in the heart tissue of non-IR control and 56Fe-IR mice at 24 h and up to 28 days post-IR. CD68 (+) cells in control hearts were set at 100% (dash-dotted line). Values are means ± SE; n = 6–8 animals per time point/group for sham-IR controls and 56Fe-IR groups. Statistical significance was assigned when P < 0.05. *P < 0.0001 and **P < 0.04 for control vs. 56Fe-IR. [These data are a revised interpretation of previously published work (78), with permission.]

