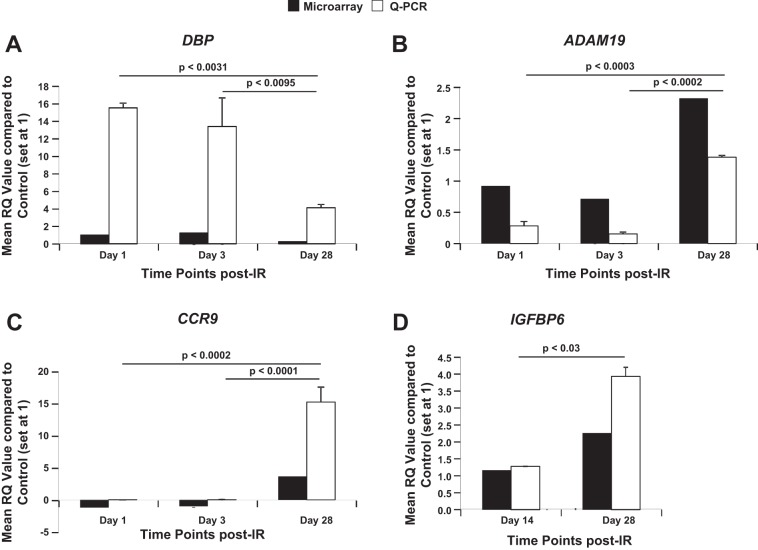
Fig. 4.
Quantitative real-time PCR (Q-PCR) confirmed microarray-based time-dependent gene expression responses up to 28 days post-IR. Graphic representation of Q-PCR analysis, mean relative quantification (RQ) values (open bars) compared with control (set at 1), and respective microarray data (solid bars) of cardiomyocytes from full-body 15 cGy 56Fe-IR mice at 1, 3, and 28 days post-IR for D site-binding protein (DBP; A), a disintegrin and metalloprotease 19 (ADAM19; B), and chemokine (C-C motif) receptor 9 (CCR9; C), and at 14 and 28 days for insulin-like growth factor-binding protein 6 (IGFBP6; D). Values in all graphs represent Q-PCR data as means ± SE of the pooled data from n = 3 animals per time point/group for non-IR control and 56Fe-IR groups. Statistical significance was assigned when P < 0.05.

