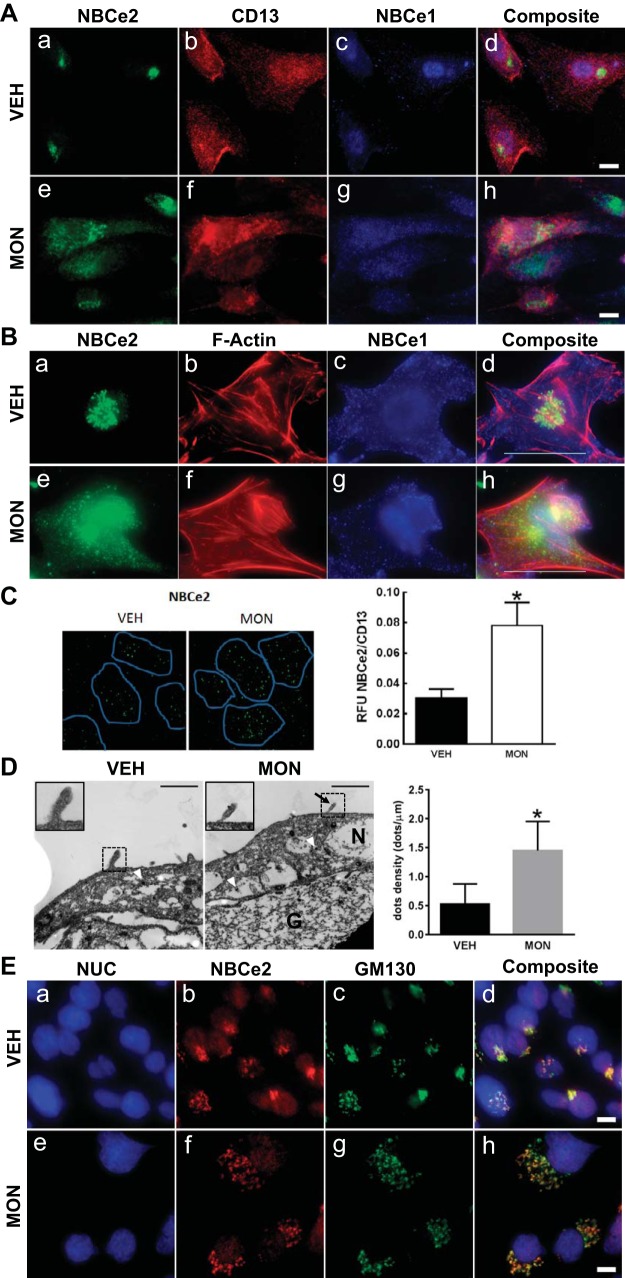
Fig. 6.
Change in localization of NBCe2 and NBCe1 following monensin treatment of RPTCs. A: immunofluorescent localization in primary cultures of human RPTCs obtained from freshly voided urine. NBCe2 staining is shown in green (a and e), while NBCe1 staining is shown in blue (c and g). RPTCs have a generalized red membrane staining using an antibody to CD-13, a specific membrane-bound ectopeptidase present in RPT but not in other nephron segments (b and f). All of the images were merged into a composite image (d and h); there is no overlap of NBCe2 and NBCe1. With monensin treatment, NBCe2 expression expanded and became more diffuse (e). Scale bar = 10 μm (×600 magnification). B: immunofluorescent localization of NBCe2 and NBCe1 in cultured immortalized human RPTCs. NBCe2 staining is shown in green (a and e), while NBCe1 staining is in blue (c and g). b and f: filamentous-actin staining with phalloidin is shown in red. All of the images were merged into a composite image (d and h). Upon the addition of monensin (MON; 3 h, 1 μmol/l), a marked change in NBCe2 localization occurred, changing from a perinuclear localization to a diffuse punctate pattern throughout the cell (compare a and e; yellow in d and h indicates NBCe2 colocalization with F-actin). Some NBCe2 remains in the perinuclear location, which is possibly stored NBCe2. By contrast, MON induced a more subtle change in the intracellular localization of NBCe1 in both the cytosol and submembranous vesicular bodies (purple in d and h indicates colocalization of NBCe1 and F-actin). In c, NBCe1 shows a uniform membranous staining pattern. After the addition of MON, g shows less uniform membranous staining with a more concentrated intracellular localization. The presence of cyan or white dots in the composite images indicates that NBCe2 and NBCe1 are present in some cellular compartments. Scale bar = 10 μm, ×600 magnification. C: apical TIRF on GEMs. The effect of monensin (MON; 10 μmol/l, 3 h) on NBCe2 apical expression was measured in polarized RPTCs grown on GEM three-dimensional microcarriers, by TIRF microscopy. TIRF imaging depth was set at 70 nm from the coverslip surface. CD-13 staining was used to indicate where the brush border contacted the coverslip (blue outline). CD-13 expression did not change with MON. The apical expression of NBCe2 (green; Alexa Fluor 488) increased when incubated with MON. The ratio of NBCe2/CD-13 RFU was measured, and MON was found to increase the apical expression of NBCe2 (*P < 0.05 vs VEH; n = 5). D: immuno-electron micrograph of polarized RPTCs. Cells were grown on gelatin-coated Transwells to form a polarized epithelium. Localization of NBCe2 was measured by immuno-electron microscopy with and without increasing intracellular sodium with MON (1 h). Positive electron-dense granules along the extreme apical membrane were counted. Intracellular positive staining granules were found in all cells, with no difference in the number of granules; however, there was an increase in the number of positive staining granules in the apical membrane of cells that had increased intracellular sodium (P < 0.05; n = 3–5). NBCe2 was found more often within microvilli under elevated sodium conditions, see inset. Arrowheads indicate NBCe2-associated electron-dense granules on the apical membrane within microvilli. N denotes the nucleus, while G denotes gelatin. Scale bar = 1 μm. E: staining of RPTCs using markers for subcellular compartments. Immunofluorescence staining is shown for NBCe2 (b and f) and GM130 (Golgi-specific marker; c and g), and nucleus (NUC) (a and e). The composite image (d and h) shows a high degree of colocalization between NBCe2 and GM130 under both vehicle and monensin conditions. Magnification was ×600; scale bar = 10 μm.

