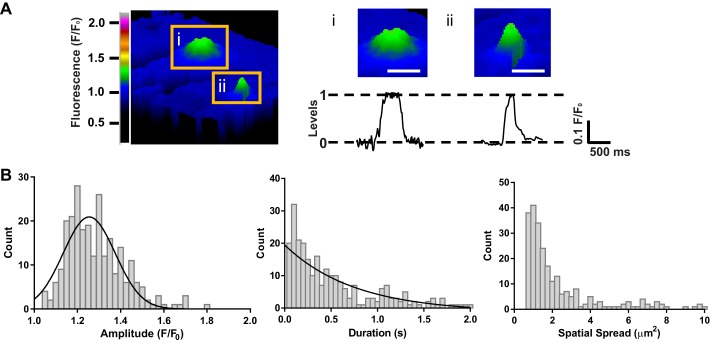
Fig. 5.
Characteristics of TRPV3 sparklets in primary PA EC. A, left: pseudocolored image (F/F0) of 2 distinct sparklet sites (insets i and ii) in the same EC after addition of carvacrol (30 μM). Scale bar, 5 μm. A, right: representative traces of fluorescence intensity (F/F0) over time for the sparklets shown in images i and ii above trace. The majority of carvacrol-induced TRPV3 sparklets (30 μM) had an amplitude of 1.20 F/F0. Scale bar, 3 μm. B: histograms of TRPV3 sparklet amplitudes (left), durations (middle), and spatial spreads (right). One prominent peak was observed at an amplitude of F/F0 = 1.20, as seen in the traces of fluorescence in A; n = 256 total events.

