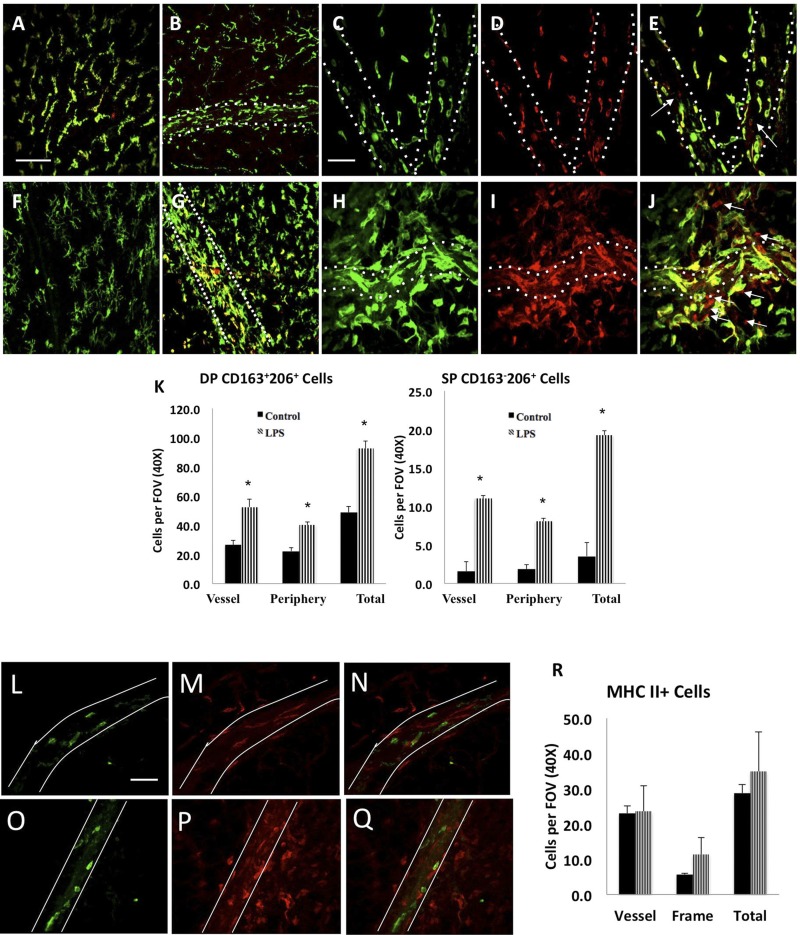
Fig. 3.
Macrophage accumulation and M2 polarization in the LPS-treated rat mesentery. Top: mesenteric arcades from control (A–E) and intraperitoneal LPS-injected (F–J) were stained for CD163 (green) and CD206 (red). Arrows indicate the single-positive CD163-CD206+ cells. Mesenteric lymphatic collecting vessels are outlined with dashed white lines. K: quantification of the M2 macrophage phenotypes in control and LPS-injected rats; *P < 0.05. DP denotes double-positive (CD163+206+) cells; SP denotes single-positive cells (CD163−206+). A minimum of five ×40 fields were quantified and averaged per animal (n = 4). Within the FOV for every image stack analyzed, cells that were directly in contact with the vessel were counted and represented as “vessel”, and the remaining cells were considered to be in the “periphery”. Magnification in A, B, F, G: ×20 magnification; scale bar = 150 μm. A common scale bar for all figure panels is indicated. Magnification in C, D, E, H, I, J: ×40; scale bar = 75 μm. A common scale bar for all figure panels is indicated. Data are represented as means ± SE. *Significant difference, P < 0.05. L–R: LPS treatment does not promote M1 but M2 macrophage phenotype on and around the mesenteric lymphatics. Control (L–N) and LPS (O–Q)-treated animals were stained for MHCII (blue) and CD206 (red). Magnification in L and O: ×40; scale bar: 75 μm. Magnification in M and P: ×20 magnification; scale bar: 150 μm. A common scale bar for all figure panels is indicated. A minimum of five ×40 fields were quantified and averaged per animal (n = 4).

