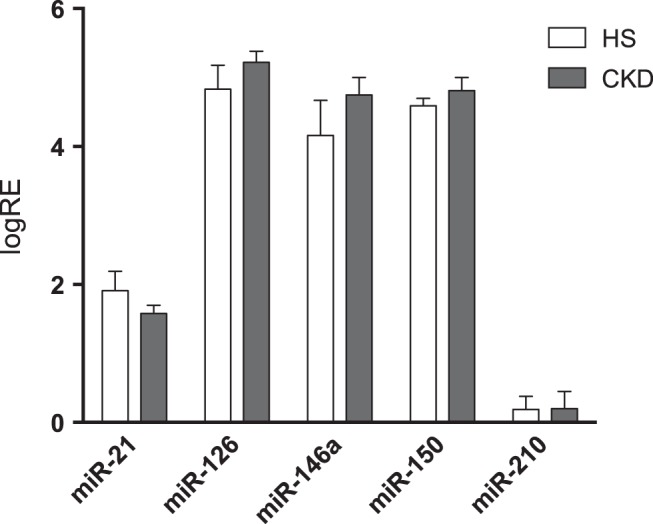
Fig. 2.

Circulating miRNA at steady state in CKD and HS (study 1). Values are the mean logarithm of the relative expression (logRE) of the respective miRNA ± SE. Baseline plasma levels of all studied miRNAs were comparable between the studied CKD patients (n = 32) and HS (n = 12).
