Fig. 1.
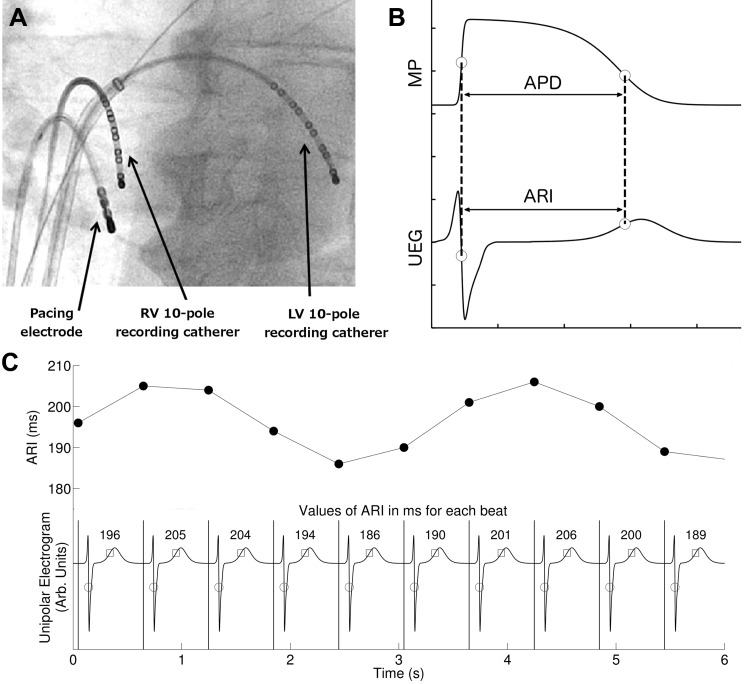
Electrophysiological measurements. A: fluoroscopic image showing the position of the two 10-pole recording catheters located in the left ventricle (LV) and right ventricle (RV). B: diagrammatic representation of the relationship between the unipolar electrogram (UEG) and the intracellular ventricular transmembrane potential (MP) during an action potential (AP) showing that the activation recovery interval (ARI) corresponds to the action potential duration (APD). C: example of ARI measurements of the local UEG: times of activation are marked with circles [minimal change in volume over time (dv/dtmin) of the QRS] and repolarization with squares [maximal change in volume over time (dv/dtmax) of the T wave]. The interval between the 2 points is the ARI, and values for each beat are shown in milliseconds. Top: corresponding ARIs plotted as function of time.

