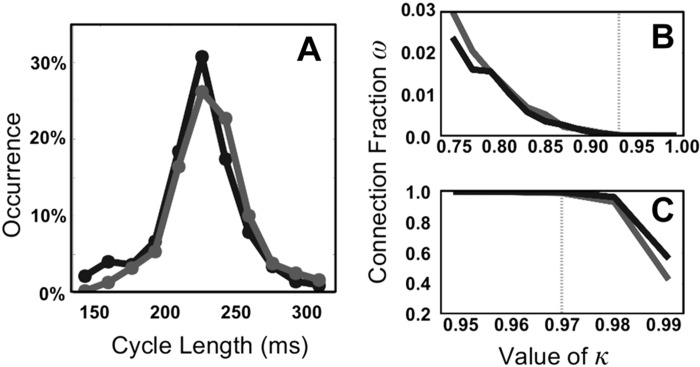
Fig. 1.
A: distribution of cycle lengths for 2 representative patients shown in black and dark gray. B: fraction of synchronized connections, ω, as a function of the threshold κ. The activation times of the electrodes are randomly taken from the 2 distributions shown in A. Demanding that the percentage approaches 0 establishes the lower bound κ ≥ 0.92, shown by the dotted light gray line. C: as in B but now for a grid in which each electrode, taken from the 2 distributions in A, has identical activation times plus a normally distributed noise term. An upper bound on the threshold can be established by requiring that the percentage remains high despite the presence of noise: κ ≥ 0.97 (dotted light gray line).

