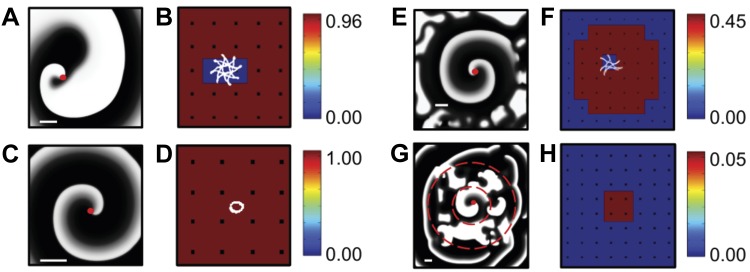
Fig. 2.
A: snapshot of a simulation with a single stable spiral wave. Membrane potential is shown using a grayscale. Parameters taken from set 1 in Ref. 5, modified to create stable spirals (τv2− = 10 and τv2+ = 220). The location of the spiral wave tip is indicated by a red dot. B: synchronization index (SI) color map corresponding to A, with red corresponding to highly synchronized electrodes and blue corresponding to asynchronous electrodes. The tip trajectory is indicated in white. C: snapshot of a simulation containing a spatially conserved spiral wave with only a small meander, obtained using the Modified Beeler-Reuter parameter set from Ref. 4. D: SI color map corresponding to C with the tip trajectory in white. E: snapshot of a simulation in a domain consisting of a central region, harboring a single stable spiral, surrounded by a region in which this spiral breaks down into irregular, stochastic dynamics. Parameter values were taken from parameter set 3 in Ref. 5 with τr = 40 in the inner and τr = 27 in the outer domain. F: SI color map corresponding to E, which displays a synchronized central region and an asynchronous outer region. The tip trajectory of the spiral wave is shown in white. The snapshots and corresponding SI color maps have been scaled to emphasize tip meander, with scale bar = 1 cm shown in white. G: snapshot of a simulation in which a central region (within the smaller dashed circle), containing a stable nonmeandering spiral as in A with decreased diffusion constant, is surrounded by a region of spiral-wave breakdown which, in turn, is surrounded by a slow-conducting region with planar propagation (outside the larger dashed circle). Activation in the outer region occurs at irregular times and locations, resulting in a corresponding SI map (H), which shows that only the spiral wave region is synchronized.

