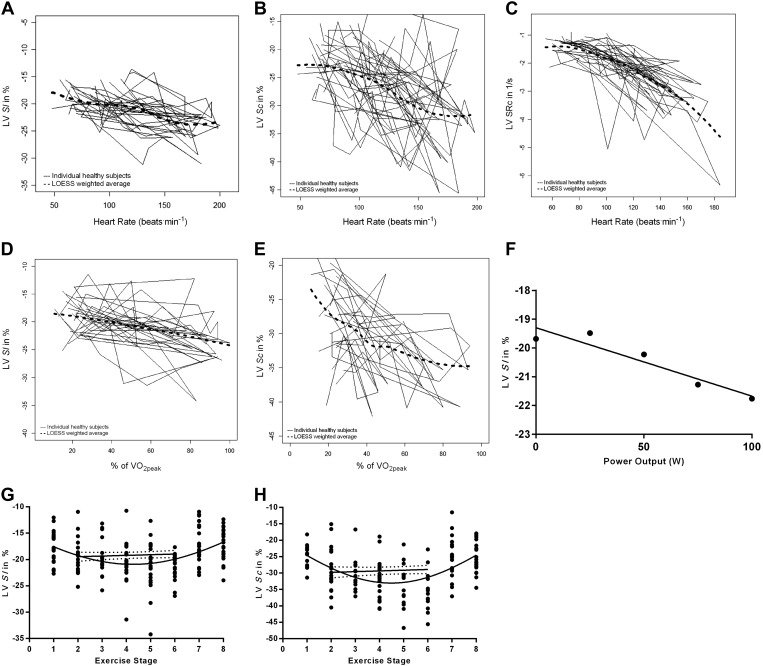
Fig. 4.
A–C: variability of LV Sl, LV Sc, and LV SRc with heart rate during exercise. The individual curves for each study participant are shown together with a locally weighted scatterplot smoothing (LOESS) weighted average. D–E: variability of LV Sl and LV Sc with percentage of V̇o2peak during exercise. The individual curves for each study participant are shown together with LOESS-weighted average. F: linear regression analysis of the relationship between LV longitudinal global systolic strain and power output; Gaussian distribution and linear regression analysis of the relationship between LV Sl (G) and LV Sc (H) and exercise stage. Exercise stages: 1–8 as rest, 0, 25, 50, 75, 100 W, 2-min recovery, and 10-min recovery, respectively.

