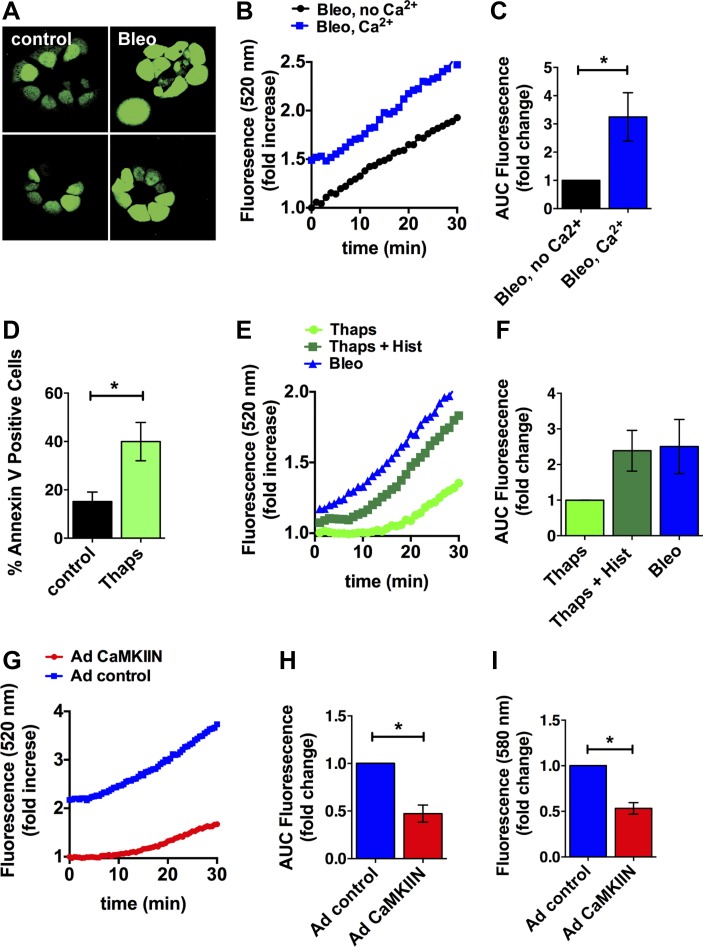
Fig. 6.
CaMKII regulates ER Ca2+ release in response to bleomycin. A: intracellular Ca2+ levels by fluo-4 fluorescence after bleomycin treatment for 10 min in MLE-12 cells. B: cytoplasmic Ca2+ levels were determined in MLE-12 cells during treatment with 50 mU/ml bleomycin in Hanks' buffered saline solution with and without Ca2+. Negative control data were subtracted from the measurements with agonists. A representative experiment is shown. C: area under the curve (AUC) was determined in 4 independent experiments and plotted as fold increase. D: apoptosis in MLE-12 cells after treatment with 100 nM thapsigargin for 24 h. E: cytoplasmic Ca2+ levels in MLE-12 cells during treatment with 50 mU/ml bleomycin, 100 nM thapsigargin, and 100 nM thapsigargin with 10 μM histamine. A representative experiment is shown. F: AUC was determined for each condition in 4 independent experiments and plotted as fold increase. G: cytoplasmic Ca2+ levels in MLE-12 cells that were infected with adenovirus expressing the CaMKII inhibitor peptide CaMKIIN or control for 48 h during treatment with 50 mU/ml bleomycin in Hanks' buffered saline solution with Ca2+. A representative experiment is shown. H: AUC was determined in 5 independent experiments and plotted as fold increase. I: Rhod-2 fluorescence in MLE-12 cells infected with adenovirus expressing the CaMKII inhibitor peptide CaMKIIN or control after bleomycin treatment for 10 min. *P < 0.05.

