Fig. 4.
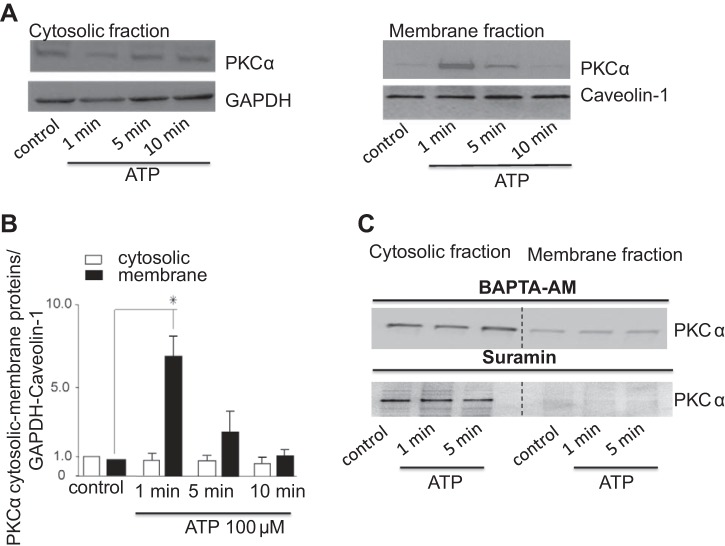
ATP stimulates PKCα translocation to the plasma membrane. Cells were exposed to ATP (100 μM) at indicated time points and harvested for protein or fractionated into membrane and cytosolic portions as described in experimental procedures. The samples were then subjected to 4–12 gradient SDS-PAGE and Western blotting using anti-PKCα polyclonal antibody. A: Western blot of cystosolic (left) and membrane (right) fractions using anti-PKCα antibody. B: quantitative data showing relative PKCα abundance in cytosol and membrane fractions normalized to GAPDH or caveolin-1 levels at indicated time points after ATP addition. Bars represent means ± SE; n = 4. *P < 0.05 vs. control (nontreated cells). C: representative Western blot of n = 3 trials with similar results is shown. Cytosolic and membrane fractions using anti-PKCα antibody are shown on the left and right, respectively. Cells were stimulated with ATP (100 μM) at indicated time points in the presence of the P2 receptor inhibitor suramin or after incubation with the intracellular Ca2+ chelator BAPTA-AM (50 μM for 1-h pretreatment).

