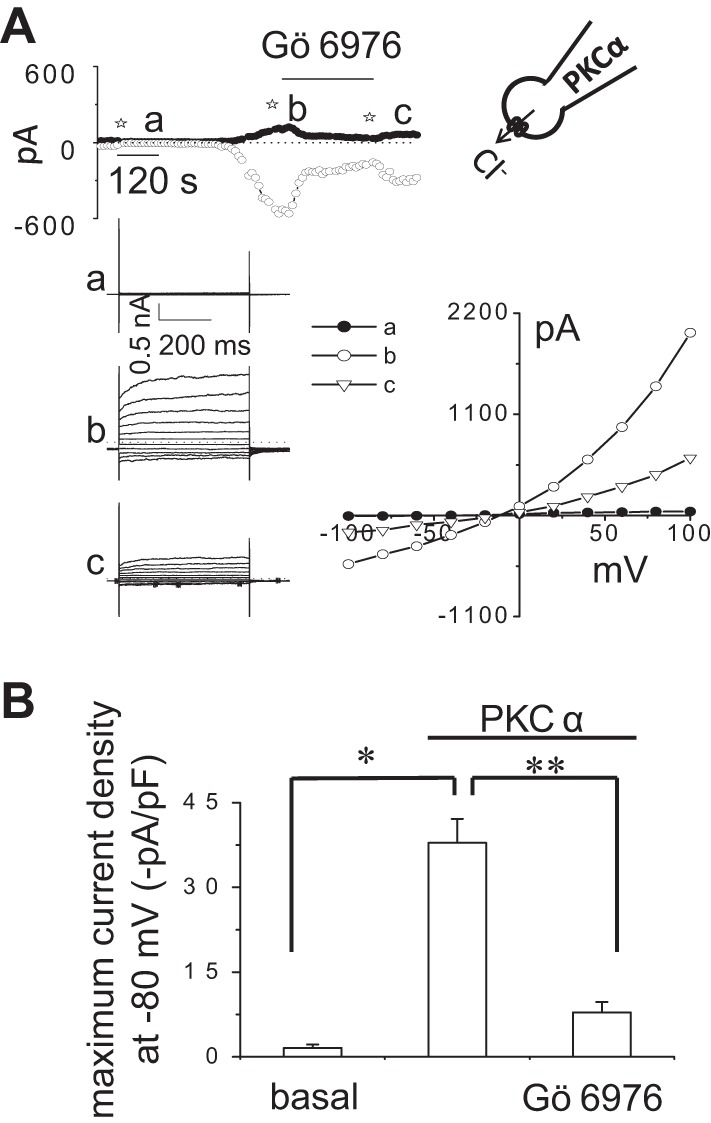
Fig. 5.

Intracellular dialysis with recombinant PKCα activates Cl− currents. Representative whole cell currents recorded during intracellular dialysis with PKCα (60 ng/ml) by inclusion in the patch-pipette (A). In these select studies, 50 nM PMA and 1 mM MgATP were also included in the patch pipette to serve as cofactors for phosphorylation. Currents measured at −80 mV (○), representing ICl−, and at 0 mV (●), representing IK+, are shown. Horizontal bar above the trace indicates application of the PKC inhibitor Gö6976 (10 μM) in the bath solution. The voltage-step protocol (400 ms steps from −100 to +100 mV in 20-mV increments) was obtained at ☆a, ☆b, and ☆c as indicated and used to generate the I–V relation, representing initial (basal) (●) and maximal PKCα-stimulated currents during control conditions (○) and in the presence of Gö6976 (▽). Cumulative data show the magnitude of PKCα-stimulated currents, reported as current density (−pA/pF) in presence or absence of Gö6976 (10 μM) measured at −80 mV (B) (n = 5). *P < 0.01 vs. basal. **P < 0.01, PKCα-stimulated currents are significantly inhibited by Gö6976 and PKCα significantly increases whole cell currents.
