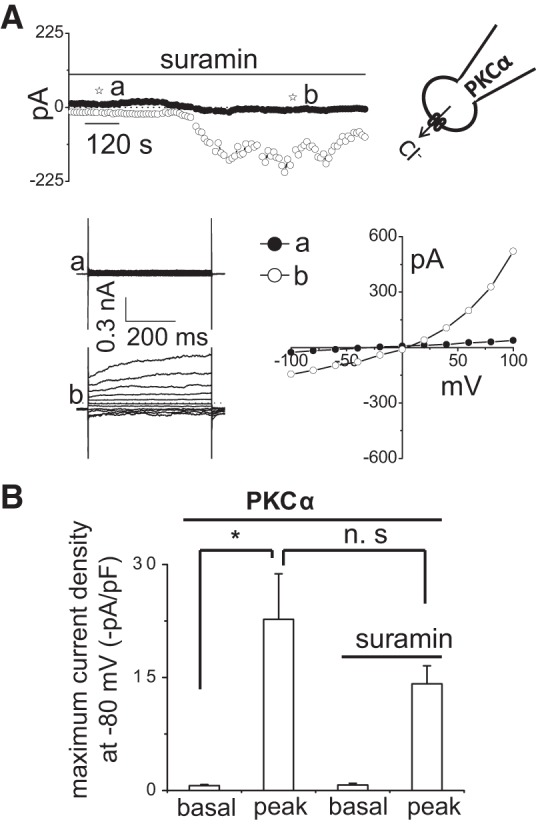
Fig. 6.

Intracellular dialysis with PKCα directly activates Cl− currents independent of ATP release and P2 receptor stimulation. Representative whole cell currents recorded in response to intracellular dialysis with PKCα (60 ng/ml), 50 nM PMA, and 1 mM MgATP in patch-pipette (A). Currents measured at −80 mV (○), representing ICl−, and at 0 mV (●), representing IK+, are shown. Horizontal bar above the trace indicates presence of suramin (100 μM) in bath solution. The voltage-step protocol (400-ms steps from −100 to +100 mV in 20-mV increments) was obtained at ☆a and ☆b as indicated and used to generate the I–V relation during initial (●) and PKCα-stimulated conditions in presence of suramin (○). B: cumulative data demonstrating the peak current density (−pA/pF) in response to intracellular dialysis with PKCα in the presence or absence of suramin (100 μM) measured at −80 mV; n = 4–5 each, n.s. = not significant. *P < 0.01 vs. basal.
