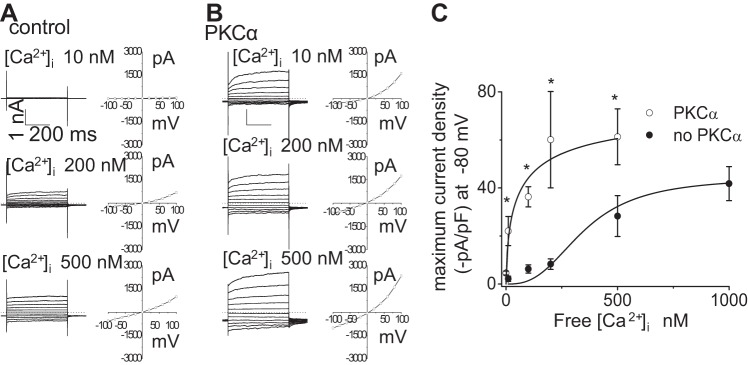
Fig. 7.
PKCα-stimulated currents are dependent on intracellular [Ca2+]. Representative whole cell currents (utilizing voltage-step protocol, see experimental procedures) recorded in response to increasing [Ca2+]i in pipette solution (10, 200, and 500 nM; shown at left) and corresponding I–V relation (plotted at right) in the absence (A) or in the presence (B) of PKCα (60 ng/ml) in dialyzing pipette. C: [Ca2+]i dose-response curve for Cl− currents. Data were plotted from maximum current density (pA/pF) measured at −80 mV in response to different intracellular (pipette) Ca2+ concentrations in absence (●) or in presence (○) of PKCα (60 ng/ml) in dialyzing pipette. Each point represents means ± SE; n = 4–5 with PKCα, and n = 3–11 without PKCα; fit to the Hill equation (see experimental procedures); n = 4–5 each. *P < 0.05 vs. absence of PKCα.

