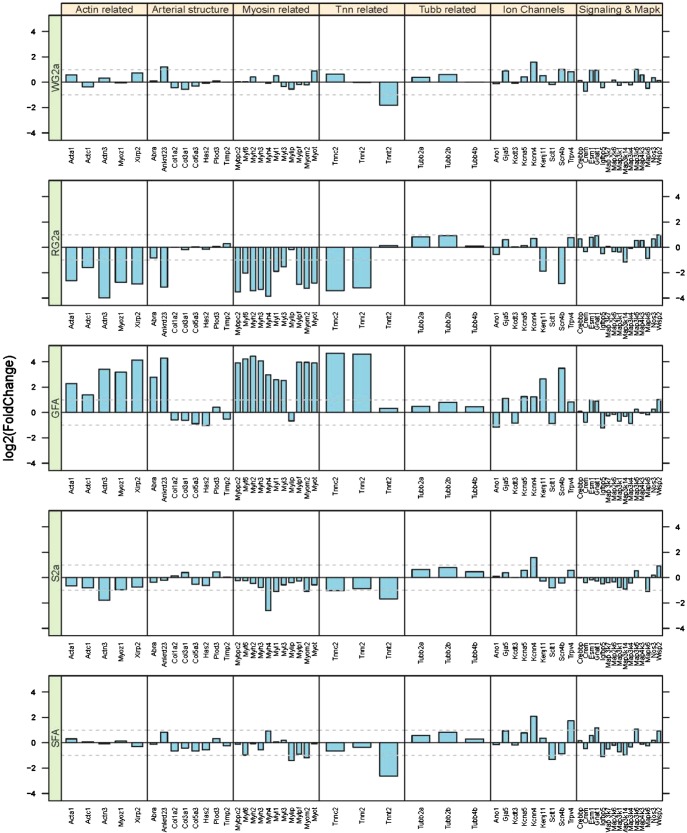
Fig. 11.
Illustration of the effects of IST (10 wk of 6 training bouts/day, 5 days/wk, with each rat running 60 m/min up a 15% incline for 2.5 min with 4.5 min of rest between bouts) on gene expression in gastrocnemius and soleus arterioles of OLETF rats. Bar graphs present changes in gene expression as fold changes in gene expression relative to the expression level of OLETF rats confined to cage activity. Categories of genes are listed across the top, specific genes are listed across the bottom. From top to bottom: WG2a, RG2a, GFA, S2a, and SFA. Notice that for Actin related, Myosin related, and troponin (Tnn) genes of the GFA (middle) how gene expression is increased, whereas expression of these same genes is decreased in S2a and RG2a and relatively unchanged in WG2a and SFA. [Published with permission (71).]

