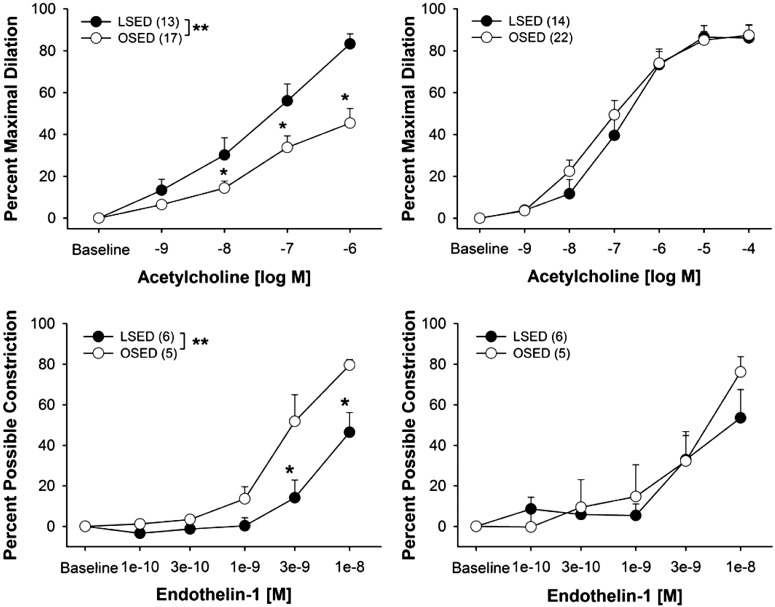
Fig. 6.
Concentration-response curves to ACh and endothelin-1 GFA (left) and soleus feed arteries (right). Data are presented as percent maximal dilation (ACh) and percent possible constriction (endothelin-1). Values are means ± SE; sample size appears in parentheses. OSED, Otsuka Long-Evans Tokushima Fatty rats that are sedentary; LSED, Long-Evans Tokushima Otsuka rats. *P < 0.05. [Published with permission (10).]

