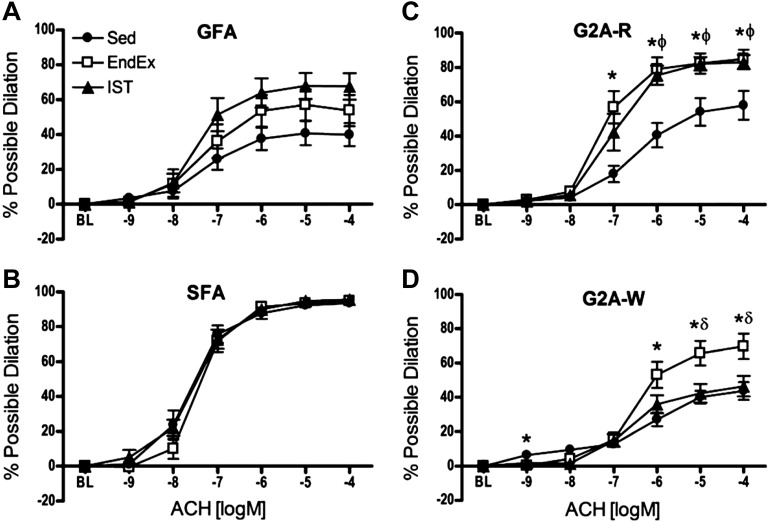
Fig. 7.
Concentration-response curves to ACh in GFAs (A), soleus feed arteries (SFA) (B), red gastrocnemius 2A (G2A-R) arterioles (C), and white gastrocnemius 2A (G2A-W) (D) from Otsuka Long-Evans Tokushima Fatty rats that were cage-confined (Sed), or underwent endurance exercise training (EndEx) or IST. Data are presented as percent possible dilation. Values are means ± SE. *Sed vs. EndEx (P < 0.0167). ϕSed vs. IST (P < 0.0167). δEndEx vs. IST (P < 0.0167). [Published with permission (81).]

