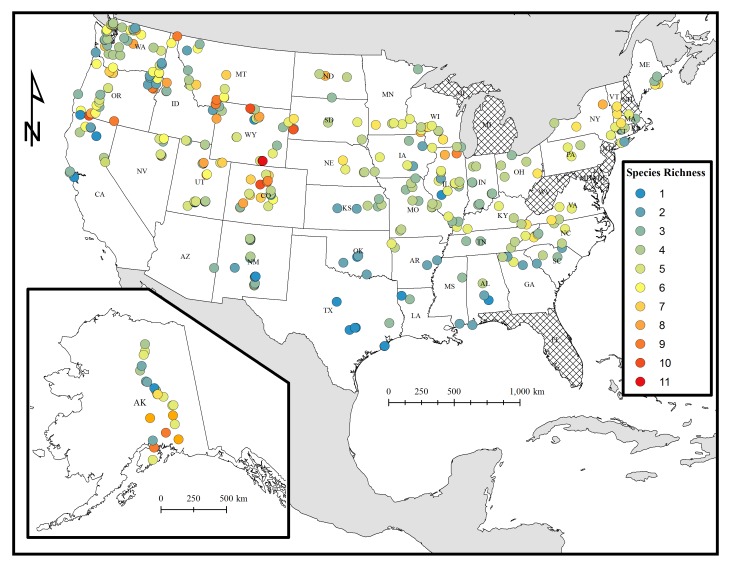
Figure 2.
Distribution of bumble bee species richness detected in surveys in the contiguous United States and Alaska. Warmer colors represent high species richness whereas cooler colors represent low richness. Species richness is simply defined as the number of different species detected at a study site. US states not included in the dataset are cross-hatched.

