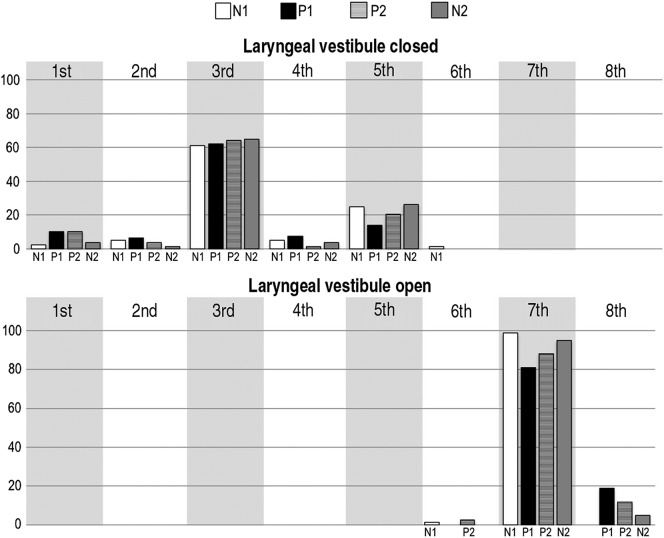
Figure 3.
The frequency (%) of each swallowing measure is plotted as events 1 through 8 across the four periods, including: all five neutral position swallows (N1), the first five chin-down swallows (P1), the last five chin-down swallows (P2), and the swallows during the return to the neutral position (N2).

