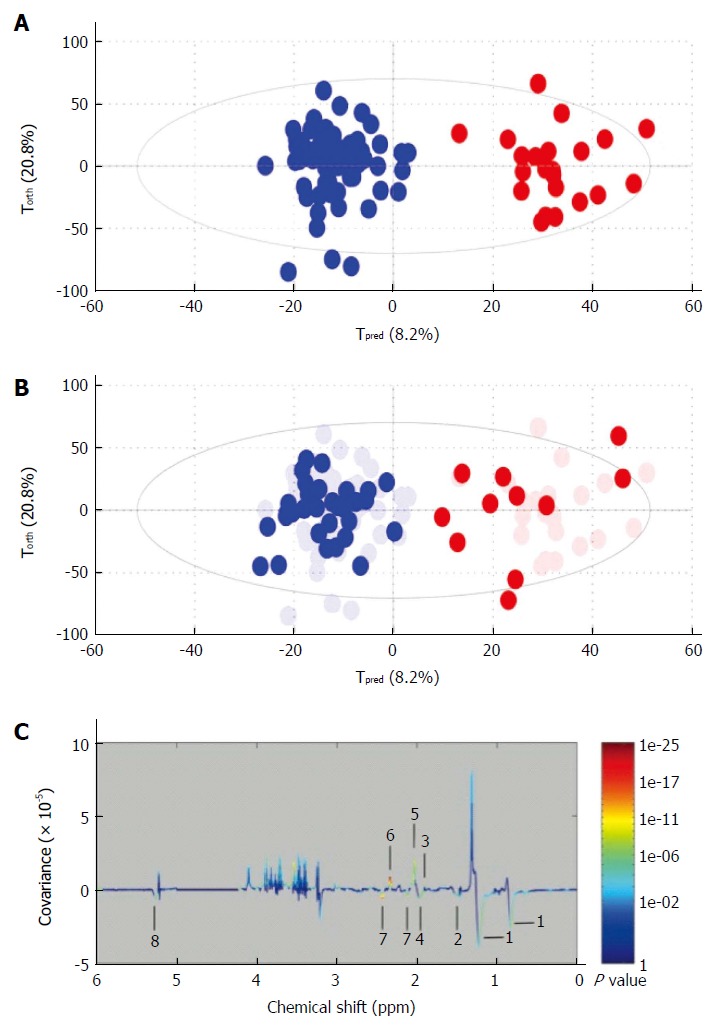
Figure 4.

Example of metabolomic study using a training and test set to validate the model. A: Creation of the model. On this Figure called score plot, each point represented the projection of an NMR spectrum (and thus one patient is sample) on both axes of the model. On this score plot, each dot corresponds to a spectrum colored according to the absence (blue) or the presence (red) of hepatocellular carcinoma (HCC). The constructed model provides a good distinction between the spectrum of cirrhotic patients without HCC and those with HCC; B: Validation of the model. Each new spectrum was projected in the score plot using the previously constructed model to enable prediction of the presence or absence of hepatocellular carcinoma (HCC). Each dot corresponds to a spectrum coloured depending on the absence (blue) or presence (red) of HCC; C: Discriminant metabolites. On this Figure called loading plot, variations of bucket intensities are represented using a line plot between 0 to 6 ppm. Positive signals correspond to the metabolites present at increased concentrations in patients with large HCC. Conversely, negative signals correspond to the metabolites present at increased concentrations in patients without HCC. 1: HDL; 2: Fatty acids; 3: Acetate; 4: Fatty acids; 5: N-acetyl-glycoprotein; 6: Glutamate; 7: Glutamine; 8: Fatty acids. Adapted from Nahon et al[29].
