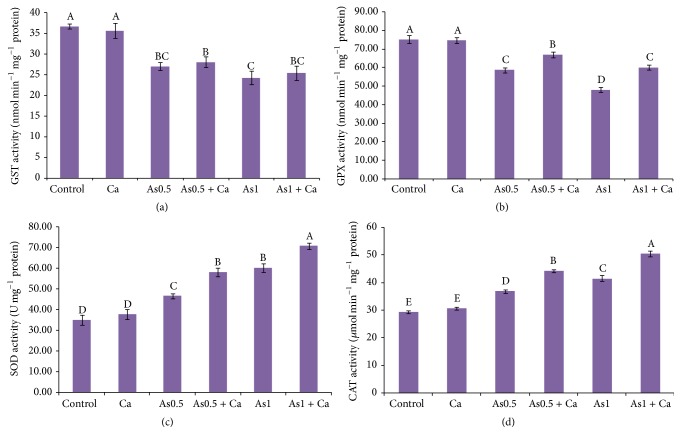
Figure 3.
Activities of GST (a), GPX (b), SOD (c), and CAT (d) enzymes in rice seedlings treated with Ca under As stress. Here, Ca, As0.5, and As1 indicate 10 mM CaCl2, 0.50 mM Na2HAsO4, and 1 mM Na2HAsO4, respectively. Means (±SD) were calculated from three replications for each treatment. Bars with different letters are significantly different at P ≤ 0.05 applying Fisher's LSD test.

