Figure 4.
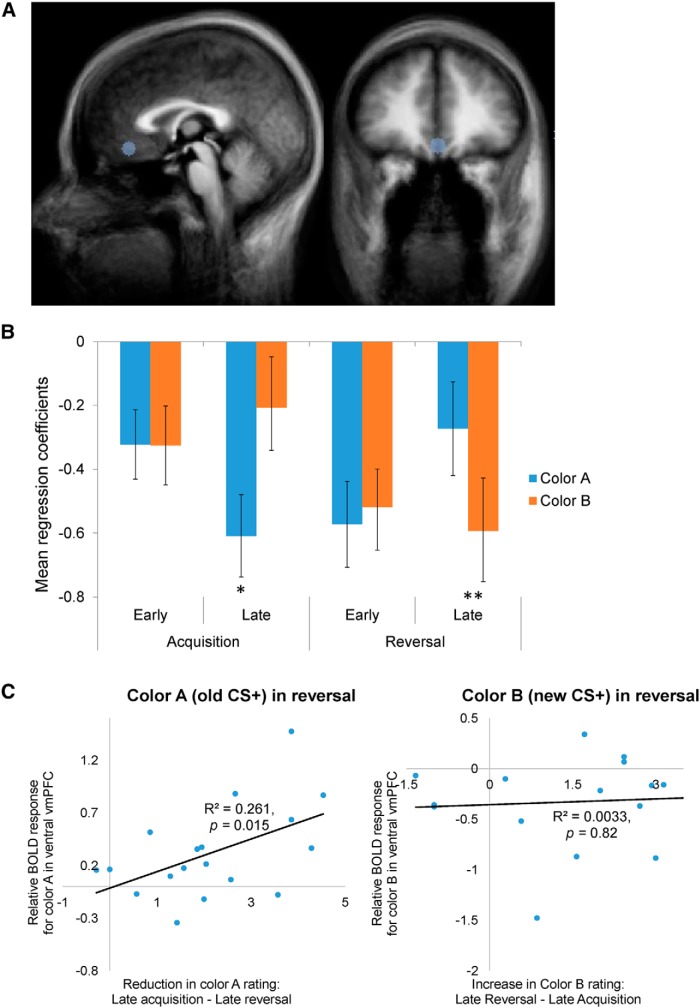
Inhibitory signals in the ventral region of the vmPFC during reward learning. A, The spatial location of the external ROI. The ROI was constructed as a sphere centered at the peak coordinates reported by a previous neuroimaging study on fear extinction (Phelps et al., 2004), with a radius of 5 mm. B, The ROI exhibited higher activation to color A (the new CS−) compared to color B (the new CS+; paired one-way t test, p < 0.006) during late reversal, and higher activation to color B (the CS−) than to color A (the CS+; p < 0.027) during late acquisition. C, Left, Relative BOLD response to color A in the late reversal phase plotted as a function of the reduction in reward expectancy ratings of color A from late acquisition to late reversal. The relative BOLD response to color A was calculated as the difference between the coefficients (β values) of colors A and B in late reversal. Significant positive correlation across participants was observed (r = 0.511, Fisher’s z-transformation, p = 0.015). Right, Relative BOLD response to color B in the late reversal phase plotted as a function of the increase in reward expectancy ratings of color B from late acquisition to late reversal. No correlation was observed between these measures (r = −0.057, p = 0.822).

