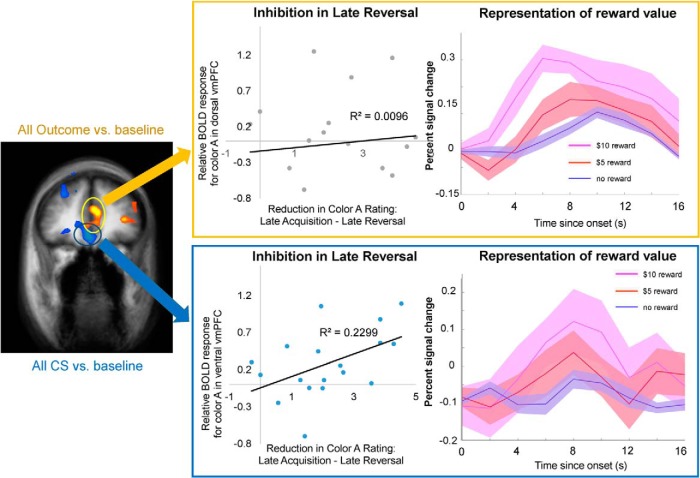
Figure 5.
Spatial segregation of value representation and response inhibition in the vmPFC. Left, Ventral and dorsal regions of the vmPFC were identified using nonbiased tests. The ventral region (highlighted in blue circle) was located by contrasting all CSs with baseline (p < 0.05 cluster-size corrected). The dorsal region (highlighted in yellow circle) was located by contrasting all outcomes with baseline (p < 0.05 cluster-size corrected). Middle, Relative BOLD activation to color A (the old CS+) in late reversal (calculated as the difference between the coefficients of the color A and color B predictors in this phase) plotted as a function of reduction in reward expectancy ratings of color A from late acquisition across all participants. Significant correlation was observed in the ventral region (r = 0.479, Fischer’s z-transformation, p = 0.022), but not in the dorsal region (r = −0.0973, p = 0.71). Right, Average percentage signal change in the activity of each ROIs for $10 reward, $5 reward, and no reward. Activity was significantly modulated by outcome magnitude in the dorsal region (significant simple main effect of magnitude in repeated-measures ANOVA on mean percentage change in BOLD activity during the second to fourth TRs following outcome, p < 0.0001), but not in the ventral region (p = 0.34).

