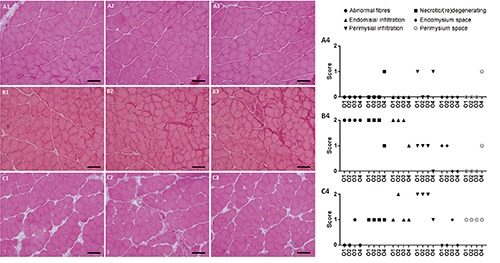
Figure 4.

Microphotographs of evaluated pictures. A4, B4 and C4 show the respective scores given by four experienced observers (O1-O4). Only the highest score from each picture was ultimately taken into account in order to better represent great anomalies such as those found in B3. Scale bars: 100 µm.
