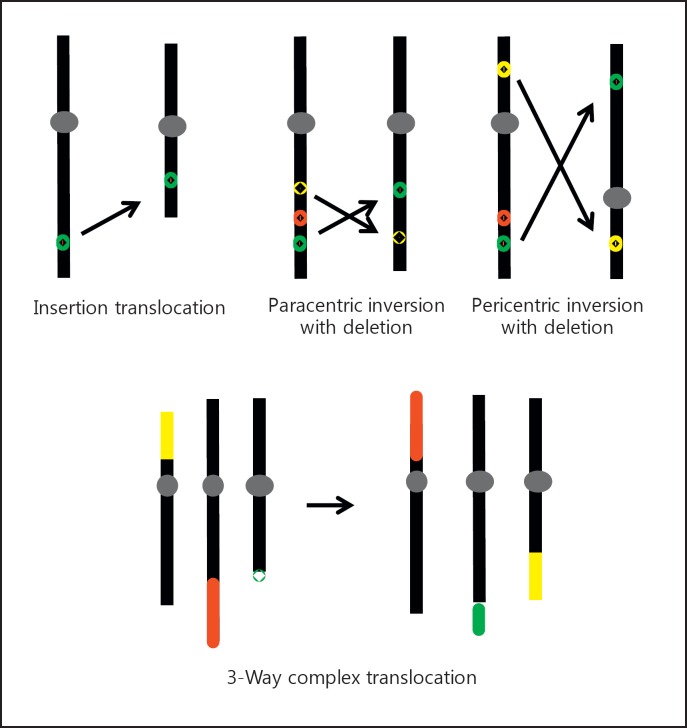
Fig. 1.
Schematic depictions of examples of CCRs including an insertion-translocation, 2 types of complex inversions, and a 3-way translocation. Top: chromosomes are in black, and centromeres are represented by gray ovals. The arrows indicate the direction of transposition of chromosomal loci and segments. Small colored symbols represent loci affected by the CCR. Red circles represent lost loci. Bottom: colored bars represent segments that are exchanged by the 3-way translocation.

