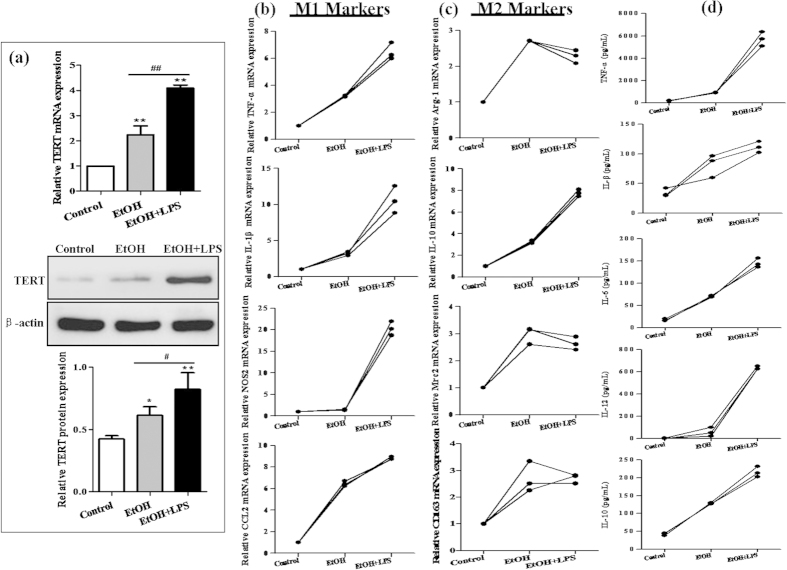
Figure 4. Effect of alcohol on TERT expression in vitro.
Acute alcohol treatment of RAW 264.7 cells can be achieved with 25 mM EtOH for 24 h. (a) TERT mRNA and protein expression in EtOH-stimulated RAW 264.7 cells were analyzed by real-time PCR and western blot. The results are shown as relative expression against control expression without treatment. The values represent means ± SD. *P < 0.05, **P < 0.01 vs control. #P<0.05, ##P<0.01 vs EtOH-treated group. (b) Effect of alcohol on M1 macrophage markers (TNF-α, IL-1β, CCL2 and NOS2) in RAW 264.7 cells without or with LPS stimulation. (c) Effect of alcohol on M2 macrophage markers (Arg-1, IL-10, Mrc2 and CD163) in RAW 264.7 cells without or with LPS stimulation. (d) Effect of alcohol on the production of cytokines including TNF-α, IL-1β, IL-6, IL-12 and IL-10 in RAW 264.7 cells without or with LPS stimulation. The results are shown as line chart.

