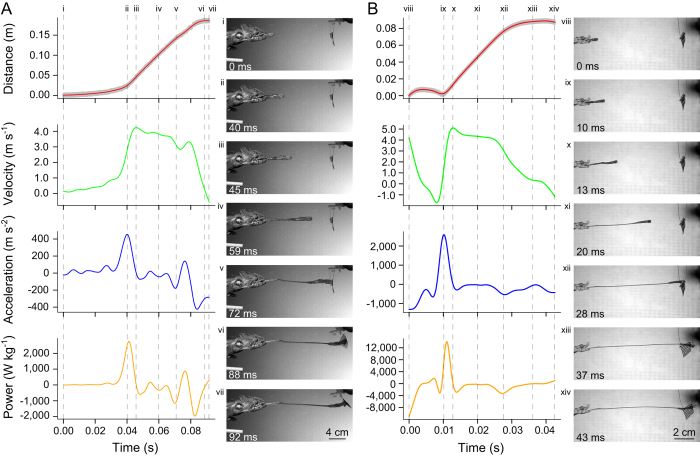
Figure 1.
Kinematic and dynamic profiles, and associated image sequences comparing a tongue projection event in (A) a 198 mm SVL Furcifer oustaleti exhibiting relatively low maximal performance and (B) a 47 mm SVL Rhampholeon spinosus exhibiting particularly high maximal performance. The feeding from F. oustaleti exhibits maximal performance levels consistent with previously published values for a similar sized Furcifer species: average of 2,340 W kg−1 (s.d. = 352 W kg−1; n = 13) in a 180 mm SVL F. pardalis14. The feeding from R. spinosus represents the highest recorded acceleration and power values recorded in our study. Vertical dashed lines correspond to the timing of images at right, corresponding to (i, viii) the start of the analyzed sequence, (ii, ix) the time of peak acceleration, (iii, x) the time of peak velocity, (iv, xi) an intermediate point during tongue projection, (v, xii) the point of prey contact, (vi, xiii) the time of maximal tongue projection distance, and (vii, xiv) the end of the analyzed sequence. Distance traces show raw position data (gray) with smoothed position trace (red) overlaid. Subsequent velocity, acceleration and power traces are calculated from the smoothed position trace.

