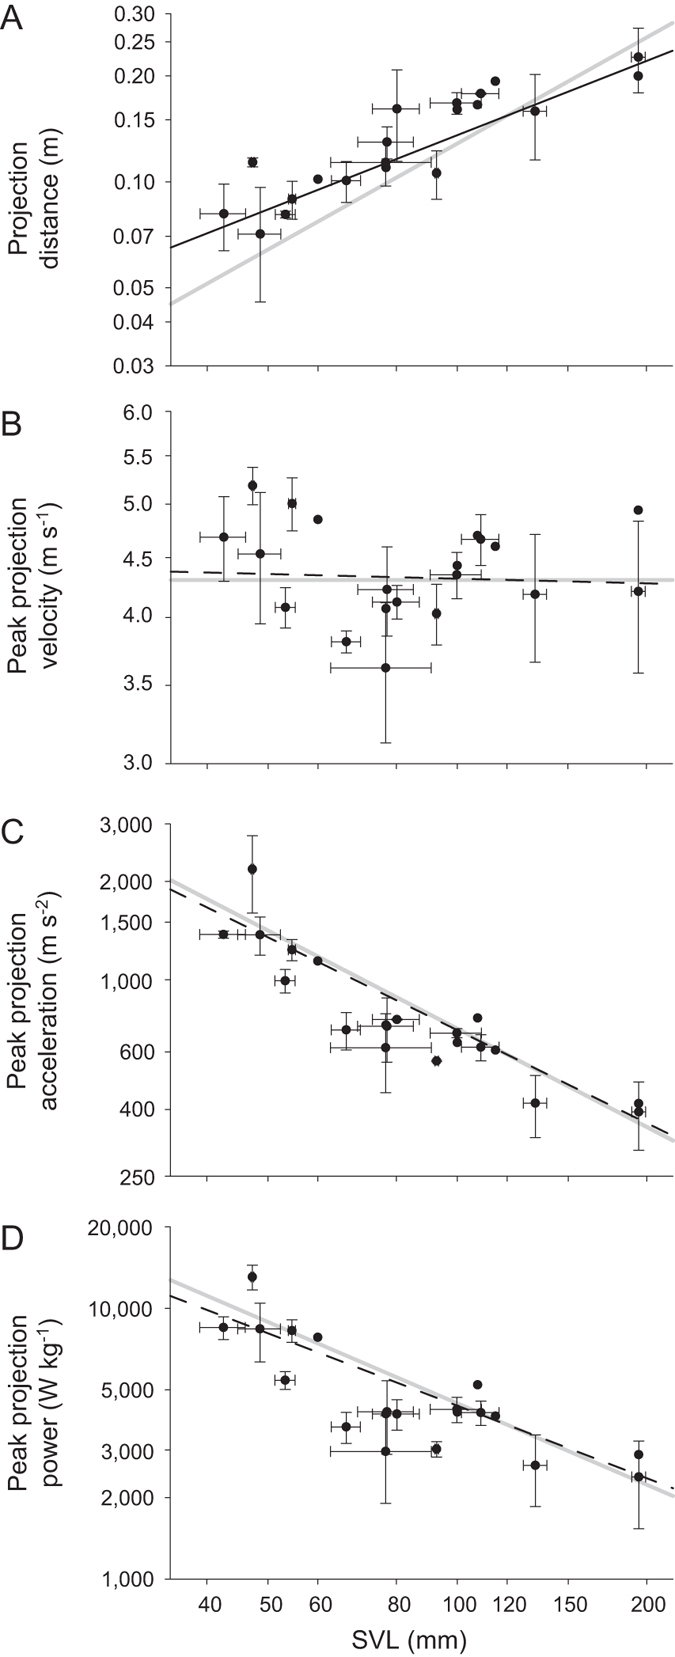
Figure 2.

Scaling relationships among species for (A) peak projection distance, (B) peak projection velocity, (C) peak projection acceleration and (D) peak mass-specific power output with respect to SVL. Graphs depict raw species averages and standard deviations of maximal performance for individuals on log axes. Solid light gray lines represent isometric slope. Dark gray lines represent observed scaling relationships among species. Solid dark gray lines represent observed scaling relationships significantly different from that expected by isometry (i.e., expected slope falls outside the 95% confidence interval around the observed slope). Dashed dark gray lines represent observed scaling relationships not significantly different from that expected by isometry.
