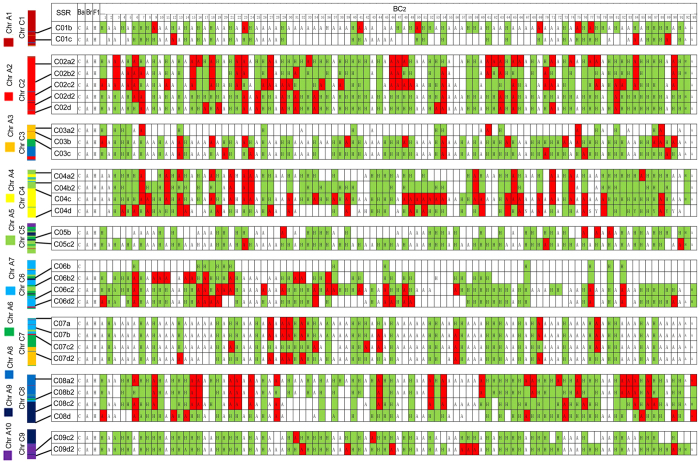
Figure 8. Chromosome recombination and segregation as indicated by SSR markers.
The C chromosomes are shown at the left. The segments homologous to A01–A10 chromosomes are indicated with ten different colors. The chromosome loci of the SSRs are given as solid lines. C, A, and H indicate the C chromosomes, A chromosomes, and hybrid type bands. The detection of C chromosome was highlighted in green, the loss of C chromosome segments resulted from intergenomic recombination are highlighted in red.

