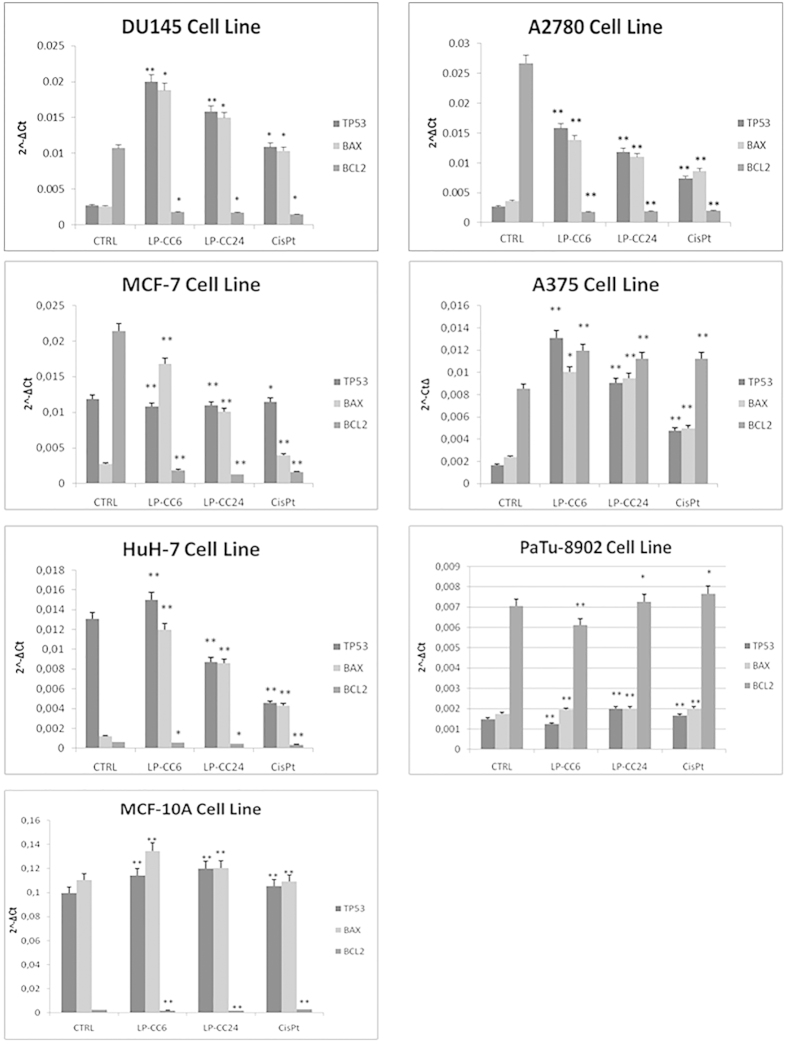
Figure 3. Real-time RT-PCR analysis.
Figure 3 shows analysis of mRNA levels of TP53, BAX, BCL2 in all cells treated with LP-CC6, LP-CC24 and CisPt alone by Real-time RT-PCR. We observed increased mRNA levels of TP53 and BAX after 3 hours of treatment with LP-CC6. The expression of these genes was lower in the presence of LP-CC24 in all cell lines except for the melanoma (A375) and pancreatic carcinoma (PaTu- 8902) cell lines. In these cells, all three drugs exhibited little effect on the expression of the transcripts examined. Also evident is a downregulation of the transcript for BCL2, well represented in almost all control cell lines, after treatment with LP-CC6 and LP-CC24. Each sample was normalized to human GAPDH. The bars indicate the mean values of three independent experiments (the bars indicate the s.d.; **p-value < 0.005; *p-value < 0.05; Student’s t-test).

