
Figure 1. Structural architecture of the SaNSR monomer.
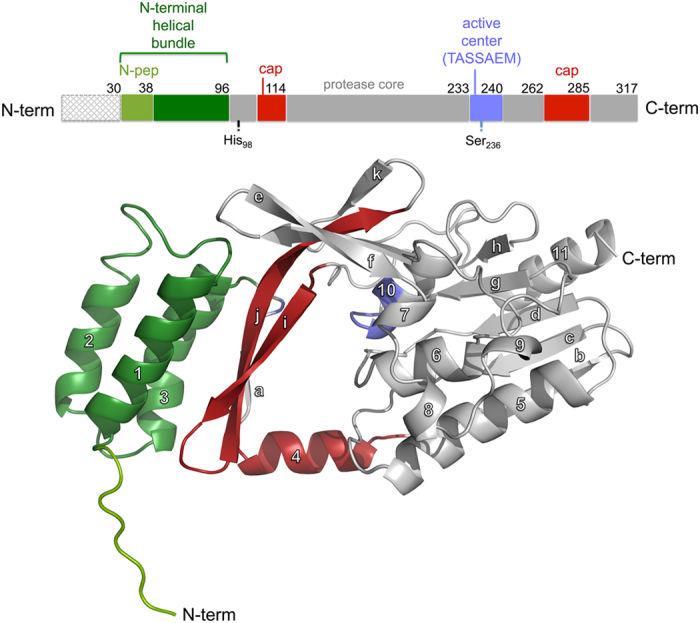
(a) Schematic illustration of the domain organization of SaNSR indicating the domain borders and catalytically important residues (His98 and Ser236). (b) The overall structure of a SaNSR monomer in a cartoon representation. The N-terminal helical bundle is depicted in green where the light green region represents the N-pep. The protease cap and core domains are highlighted in red and grey, respectively. The catalytically important residues and the highly conserved “TASSAEM” region are depicted in blue.