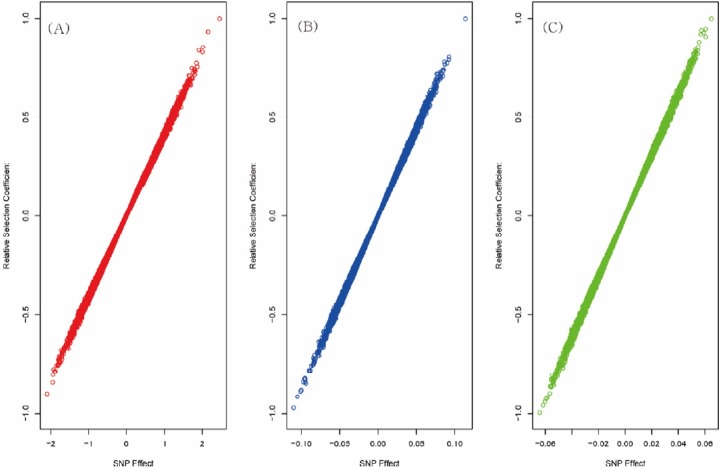
Figure 2.

Plot of single nucleotide polymorphisms (SNP) effects and relative selection coefficients of SNPs. The phenotypes were milk yield (A panel), fat (B panel) and protein content (C panel). It was estimated using SNP-genomic best linear unbiased prediction (SNP-GBLUP) and Fisher’s fundamental theorem of natural selection. The plot shows that the SNP effect is the major factor to determine the selection coefficient.
