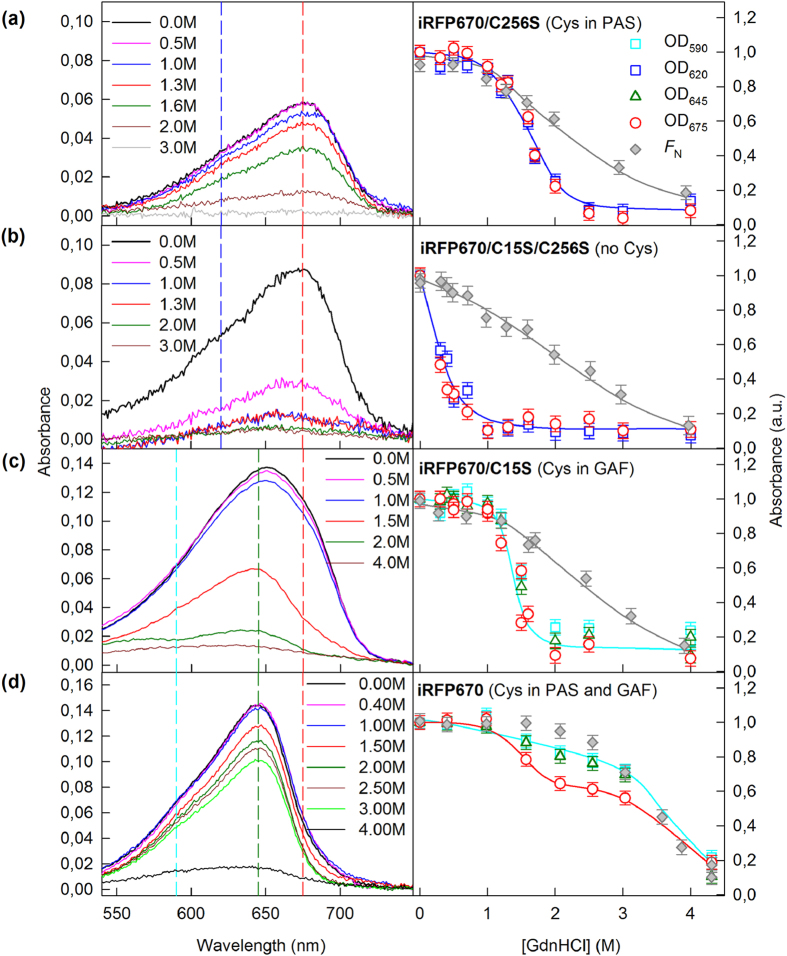
Figure 5. Change in the visible absorption of iRFP670 variants in the presence of GdnHCl.
The absorption spectra of mutant proteins at different denaturant concentrations are presented in the left panels. The numbers on the curves indicate the denaturant concentration of the protein samples. Colored vertical dashed lines show the wavelengths selected for further analysis. In the right panels, the dependences of optical densities at 620 and 675 nm, or those at 590, 645 and 675 nm, on the GdnHCl concentration are shown. The data were normalized to the absorption at the corresponding wavelength of the iRFP670 variant in buffered solution (n = 3; error bars are s.e.m.). The stability of the protein structure against GdnHCl-induced unfolding is shown as the dependences of the fraction of native molecules FN on GdnHCl concentration (gray symbols). FN was calculated on the basis of ellipticity at 222 nm.

