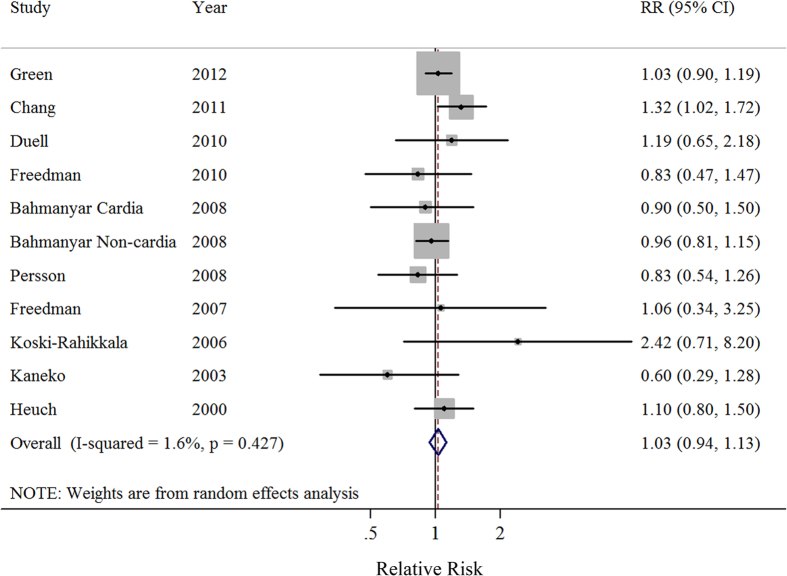
Figure 3. Forest plot (random-effects model) of parity number (highest vs. lowest) and gastric cancer risk.
The squares indicate study-specific relative risks (size of the square reflects the study specific statistical weight); the horizontal lines indicate 95% CIs; and the diamond indicates the summary relative risk estimate with its 95% CI.

