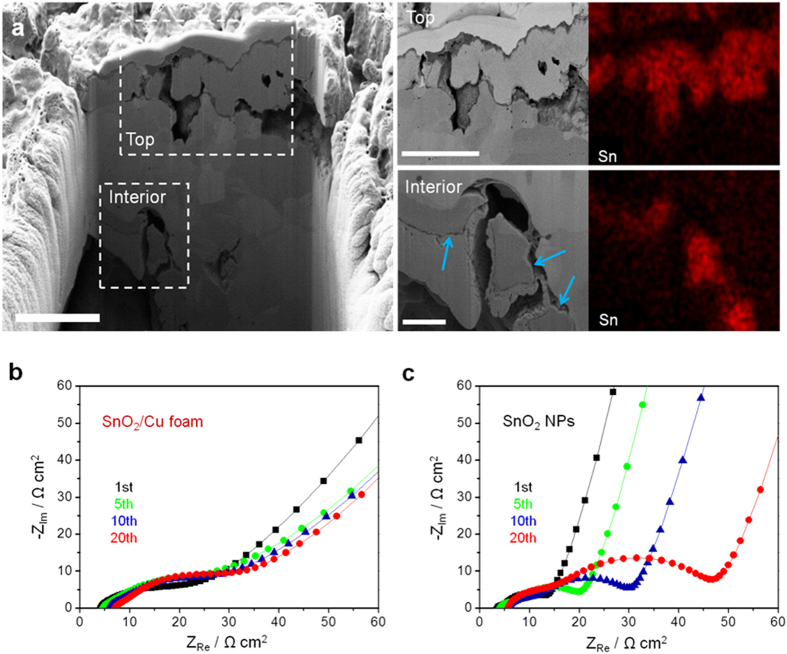
Figure 5. Morphology of SnO2/Cu foam electrode after 50 cycles and cell impedance test.
(a) Cross-sectional SEM images of the SnO2/Cu foam electrode after 50 cycles at 1 C in its entirety and at top and interior regions as indicated by the white dotted rectangles with Sn element mapping. The blue arrows indicate a preserved interior SnO2 coating layer during cycling. Scale bars, 4 μm (entirety), 4 μm (top), and 1 μm (interior), respectively. (b) Cell impedance tests of the SnO2/Cu foam and SnO2 NPs after the selected cycles at 1 C.

