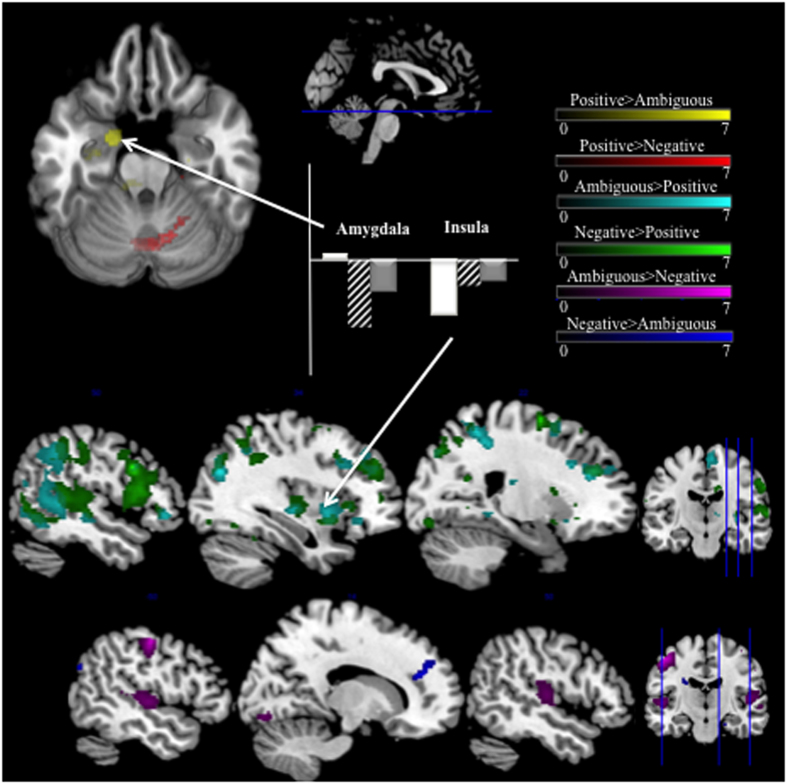
Figure 4. Between-Emotion Contrasts.
Top row shows an axial slice rendering of contrasts between positive and ambiguous improvisation (PosImprov > AmbImprov—Yellow) and positive and negative improvisation (PosImprov > NegImprov—Red). Specific to positive improvisation, we observed increased activation in the left amygdala and right cerebellum. The middle row shows sagittal slice renderings of contrasts between ambiguous and positive improvisation (AmbImprov > PosImprov—Cyan) and negative and positive improvisation (NegImprov > PosImprov—Green). These contrasts showed widespread differences, primarily in right hemisphere superior temporal lobe, right insula, anterior cingulate cortex and superior parietal lobe. The third row shows sagittal Axial slice renderings of contrasts between negative and ambiguous improvisation (AmbImprov > NegImprov—Violet, NegImprov > AmbImprov—Blue). Primary differences between ambiguous and negative Improvisation were increased anterior cingulate activation during negative, and increased right superior temporal lobe and primary motor area activations during ambiguous. Sagittal sections show axial slice location. Coronal sections show sagittal slice locations. All results are from random effects models, p < 0.005, 10 voxel cluster threshold. Bar graphs indicate percent signal change at cluster maxima, plotted using rfxplot, Glascher 2009). White = positive improvisation, Dashed = ambiguous improvisation, Grey = negative improvisation.

