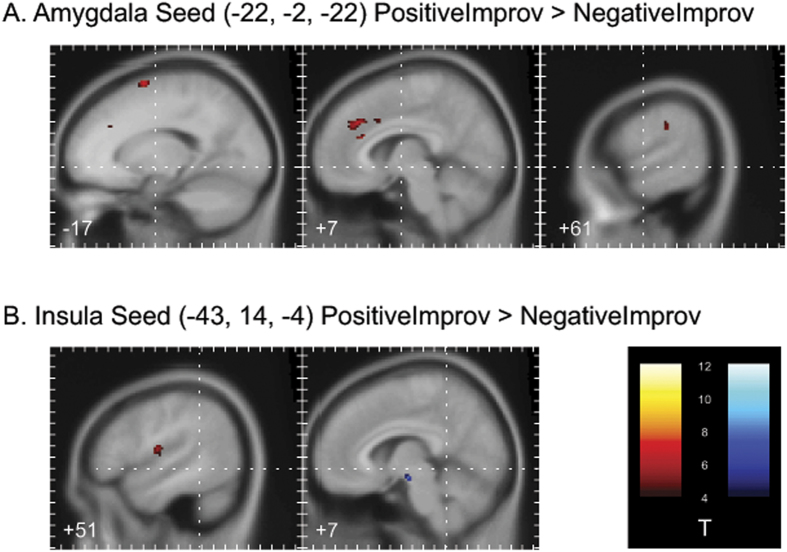
Figure 5. PPI Results.
(A) Regions showing significantly higher (in red) effective connectivity with the left amygdala (x = −22, y = −2, z = −22) during positive compared to negative improvisation [PosImprov > NegImprov contrast in gPPI analysis]. (B) Regions showing significantly higher (in red) or lower (in blue) effective connectivity with the left insula (x = −43, y = 14, z = −4) during positive compared to negative improvisation [PosImprov > NegImprov contrast in gPPI analysis]. Contrasts are thresholded at p < 0.001 (uncorrected) with a minimum cluster size of 20 voxels. Panels are plotted in the sagittal plane, with the x-coordinate of each panel indicated in the lower left-hand corner of each slice. Tick marks on the y-axis of each panel indicate differences of 10 mm in the y dimension of the image space. Tick marks on the x-axis of each panel indicate differences of 10 mm in the z dimension of the image space. Dashed lines through the center of each slice converge on the origin of the image in the axial and coronal planes. All coordinates are presented in MNI space.

