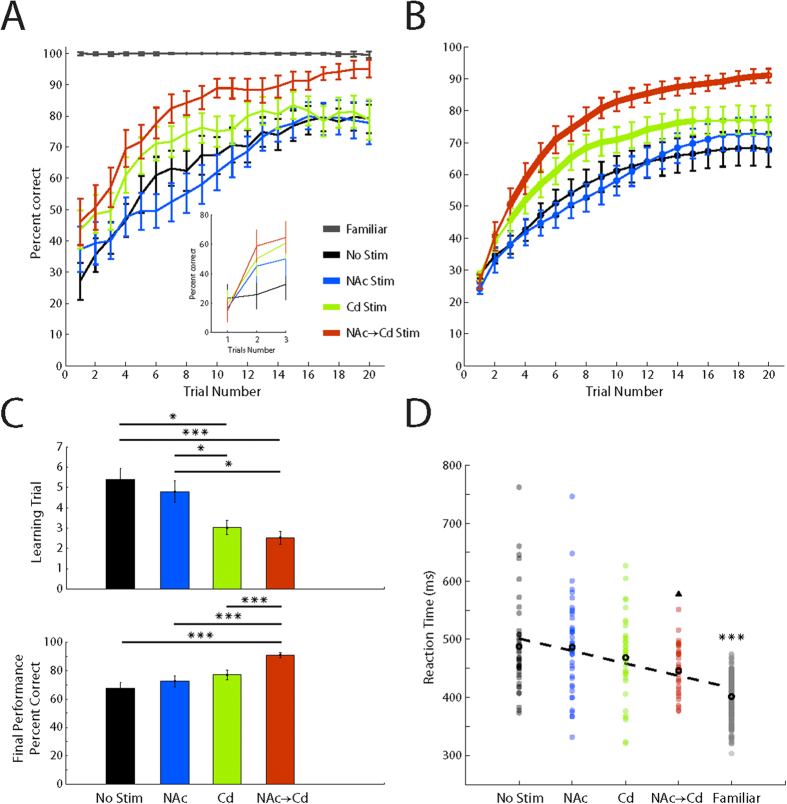
Figure 2. Effects of Deep Brain Stimulation on Associative Learning.
(A) Learning curves conveyed as percent correct across trials from animal 1. Traces represent a moving average (window size = 4) of the correct and incorrect choices made by the animal for each block condition. No Stim block (black trace) composed of n = 43 blocks (animal 2: n = 48 blocks). NAc Stim block (blue trace) composed of n = 42 blocks (animal 2: n = 25 blocks). Cd Stim block (green trace) composed of n = 39 session (animal 2: n = 27 blocks). NAc → Cd Stim block (red trace) composed of n = 34 blocks (animal 2: n = 20 blocks). Familiar images from all block conditions (gray trace) composed of n = 158 blocks (animal 2: n = 120 blocks). Inset: Mean percent correct for each of the first three trials (no sliding window). (B) State-space approach learning curves for each block condition from animal 1. Thick areas along traces indicate trials where performance on stimulated trials was significantly different from performance on non-stimulated trials. (C) Top: Distribution of learning criteria for each block condition. Bottom: Final performance for each block condition. (D) Scatter plot of reaction time sorted by final performance of each block condition and familiar images. Thick black circles represent the mean for each distribution. Dashed line represents a linear regression fit to the mean reaction time for each distribution. Triangle (▲) signifies significant difference of the NAc → Cd Stim block from the No Stim, NAc Stim, and Cd Stim blocks. Asterisk (*) signifies significant difference of the Familiar block from the No Stim, NAc Stim, Cd Stim, and NAc → Cd Stim blocks. All values are mean +/− s.e.m. (▲)p < 0.05, ***p < 0.001.

