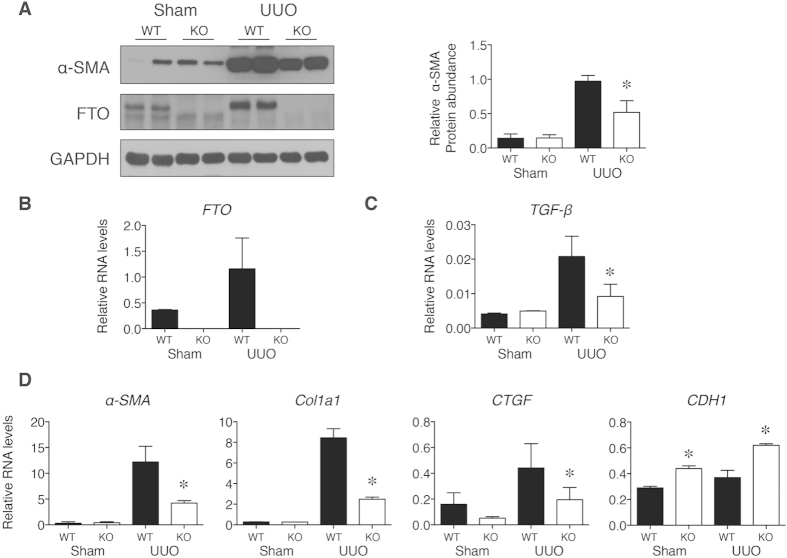
Figure 3. Protein and RNA levels in WT and FTO deficient mice (KO) after UUO.
(A) Representative western blot images and densitometry quantification of α-SMA protein concentrations from mice kidneys. (B–D) Kidney mRNAs levels after UUO surgery were analyzed and normalized to 18S. Data represent means ± SD, n = 6 mice per time point. *P < 0.05 by two-sample Mann-Whitney analysis, WT UUO groups compared to KO UUO groups.

