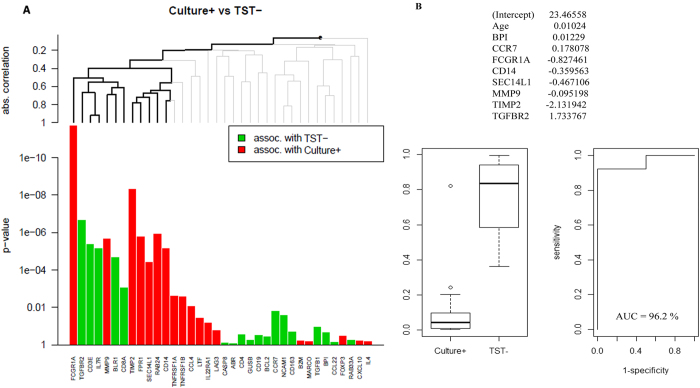
Figure 3.
Comparison of dcRT-MLPA gene expression data between culture-confirmed TB cases (culture + ) and asymptomatic TST-negative siblings (TST–) by (A) the global test and (B) Lasso analysis: The ability of biomarker signatures to predict clinical outcomes were identified following adjustment for age (months). The predicted probability of the identified biomarker signatures to discriminate between the groups is shown by: receiver operator characteristic curves (ROCs), area under the curve (AUC), and box-and-whisker plots (5–95 percentiles).

