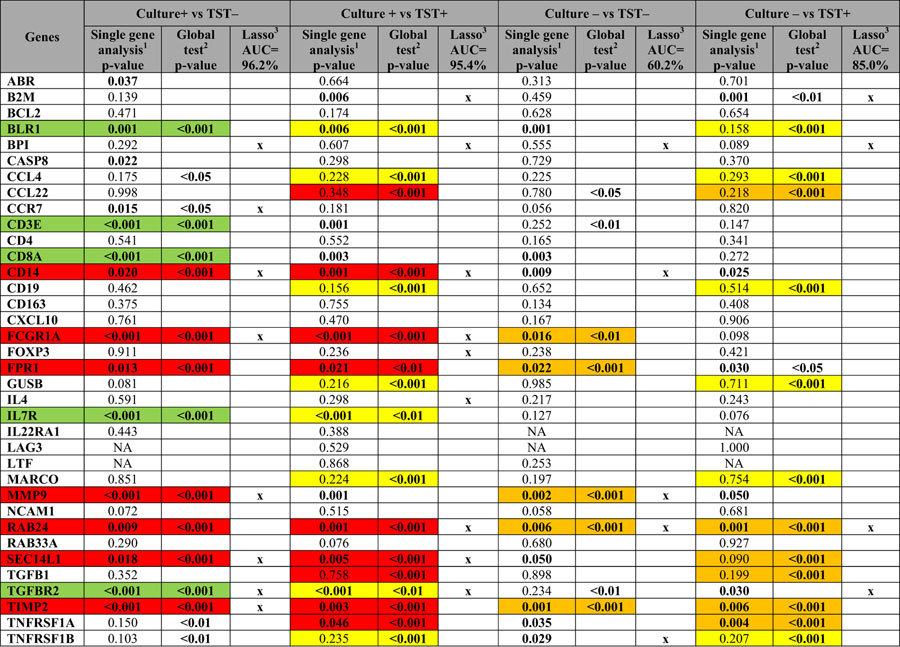
Table 3. dcRT-MLPA based gene comparisons for the TB cases (culture + , culture–) and asymptomatic household siblings (TST + and TST–).

1Linear mixed model with adjustment for age and the random effect of siblings. p value ≤ 0.05 were considered to be significant. The significant p-value is highlighted. 2Global test without controlling for age and the random effect of siblings. Only biomarkers included in the hierarchical cluster significantly expressed between the clinical groups are illustrated. 3Lasso regression, only adjusted for age, was performed for all comparisons to select the set of biomarkers (biosignature) with the best discriminatory power between the study groups. Biomarkers retained and contributing to the area under the curve (AUC) shown at the top are indicated by x.  highest gene expression associated with culture-positive for MTB.
  highest gene expression associated with culture-negative for MTB.
  highest gene expression associated with asymptomatic TST + household siblings.
  highest gene expression associated with asymptomatic TST– household siblings.
