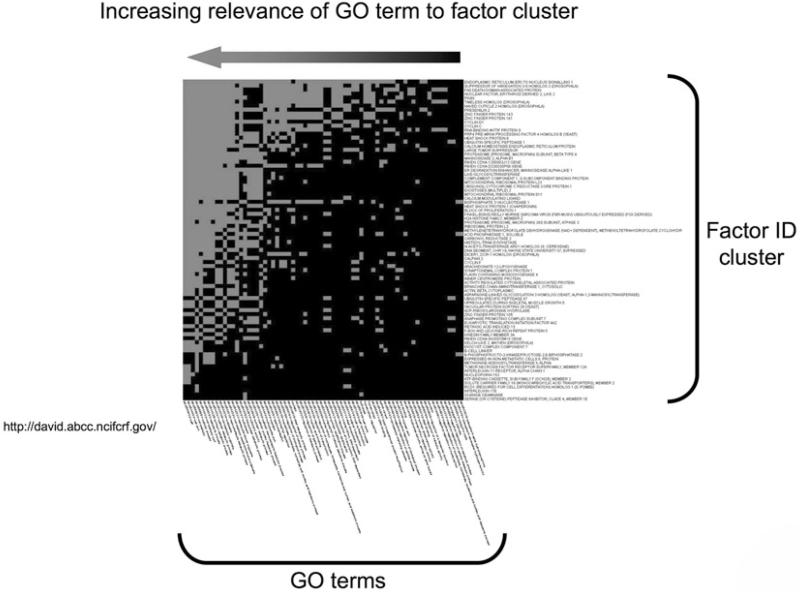
Fig. 4.
Heatmap clustering for Gene Ontology annotation. Functional annotation of factor datasets using analytical tools such as DAVID (Database for Annotation, Visualization and Integrated Discovery: http://david.abcc.ncifcrf.gov/) allow the creation of visual factor heatmap clusters according to their most commonly descriptive GO terms. A large input dataset is broken down into smaller clusters that demonstrate commonality of related GO terms. The degree of correlation intensity between the input factors and the GO terms that most closely link the majority of the factors is demonstrated by the increased presence of correlating blocks (grey). Hence, in the figure depicted the GO terms (arranged horizontally) on the far left (end of arrow) are more likely to describe the functional output of the vertically arranged factor list.

