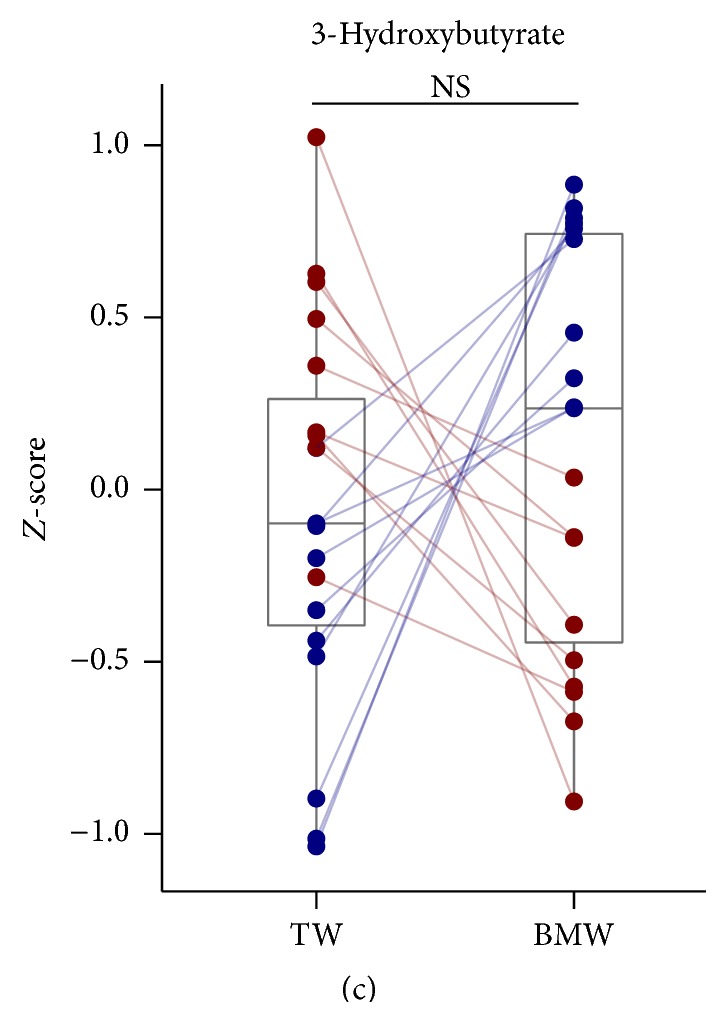
Figure 3.

Comparisons of fecal microbiota compositions between TW and BMW consumption periods. (a) Family level compositions of fecal microbiota during the test. (b) Mean relative abundances of each taxa (Z-score) of weeks 1 and 3 (TW) and weeks 2 and 4 (BMW) were shown in dot plots overlaid on box plots in the same manner as in Figure 1(a). Only 8 families that their compositions were significantly different between TW and BMW consumption periods were demonstrated. ∗ P < 0.05; ∗∗ P < 0.005.
