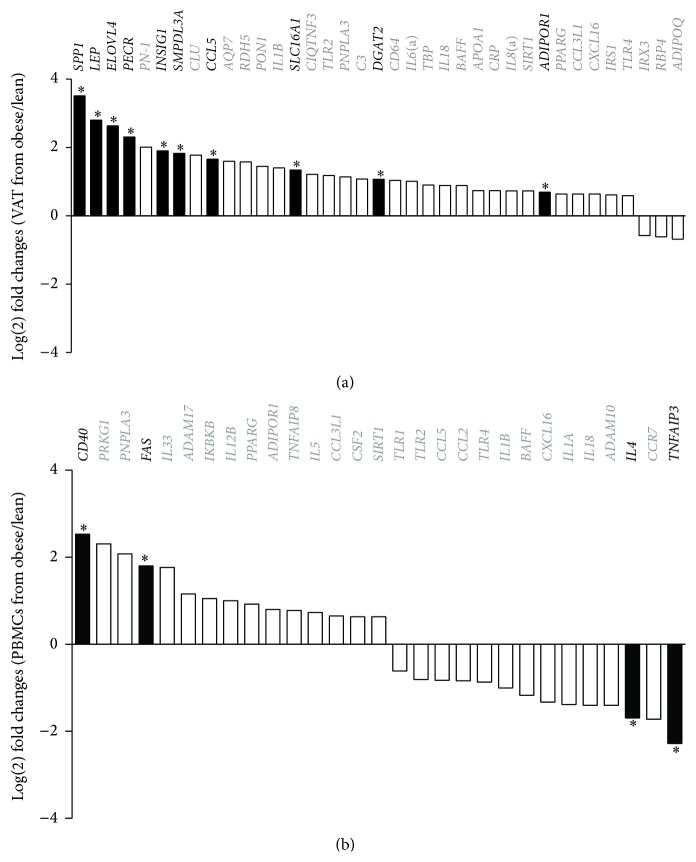
Figure 3.
Expression profile of the genes that showed a log(2) fold change ratio higher than 1.5. The log(2) difference between lean and obese pigs in the retroperitoneal adipose tissue (a) and the PBMCs (b). +log(2) FC: upregulated in obese pigs; −log(2) FC: downregulated in obese pigs. Gene names and columns in black: significant differential expression. ∗ p < 0.05.

